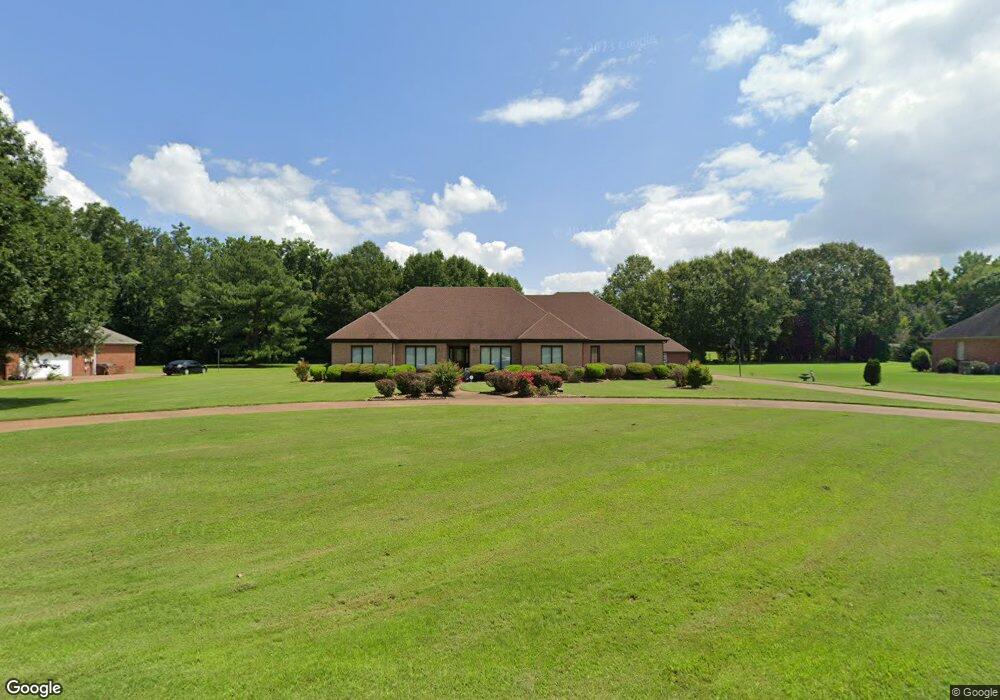
76 Shadow Ridge Dr Jackson, TN 38305
Estimated Value: $472,839 - $572,000
Studio
3
Baths
3,256
Sq Ft
$156/Sq Ft
Est. Value
About This Home
This home is located at 76 Shadow Ridge Dr, Jackson, TN 38305 and is currently estimated at $506,460, approximately $155 per square foot. 76 Shadow Ridge Dr is a home located in Madison County with nearby schools including Pope School, Northeast Middle School, and North Side High School.
Ownership History
Date
Name
Owned For
Owner Type
Purchase Details
Closed on
Apr 21, 2022
Sold by
Crystal Johnson
Bought by
Johnson Crystal and Nichelson Vernice
Current Estimated Value
Purchase Details
Closed on
Jun 24, 2014
Sold by
Johnson Crystal
Bought by
Nichelson Lloyd and Nichelson Vernice
Home Financials for this Owner
Home Financials are based on the most recent Mortgage that was taken out on this home.
Original Mortgage
$186,200
Interest Rate
4.17%
Mortgage Type
New Conventional
Purchase Details
Closed on
Feb 24, 2006
Sold by
Anderson Earl E
Bought by
Lloyd Nichelson
Home Financials for this Owner
Home Financials are based on the most recent Mortgage that was taken out on this home.
Original Mortgage
$190,600
Interest Rate
6.05%
Purchase Details
Closed on
Feb 21, 2006
Sold by
Anderson Earl E
Bought by
Lloyd Nichelson
Home Financials for this Owner
Home Financials are based on the most recent Mortgage that was taken out on this home.
Original Mortgage
$190,600
Interest Rate
6.05%
Purchase Details
Closed on
Aug 20, 1993
Purchase Details
Closed on
Sep 15, 1988
Bought by
Evergreen West Ltd
Create a Home Valuation Report for This Property
The Home Valuation Report is an in-depth analysis detailing your home's value as well as a comparison with similar homes in the area
Purchase History
| Date | Buyer | Sale Price | Title Company |
|---|---|---|---|
| Johnson Crystal | -- | Pride Nathan B | |
| Nichelson Lloyd | -- | -- | |
| Lloyd Nichelson | $238,250 | -- | |
| Lloyd Nichelson | $238,250 | -- | |
| -- | $22,500 | -- | |
| Evergreen West Ltd | -- | -- |
Source: Public Records
Mortgage History
| Date | Status | Borrower | Loan Amount |
|---|---|---|---|
| Previous Owner | Nichelson Lloyd | $186,200 | |
| Previous Owner | Evergreen West Ltd | $190,600 |
Source: Public Records
Tax History
| Year | Tax Paid | Tax Assessment Tax Assessment Total Assessment is a certain percentage of the fair market value that is determined by local assessors to be the total taxable value of land and additions on the property. | Land | Improvement |
|---|---|---|---|---|
| 2025 | $1,872 | $99,900 | $11,250 | $88,650 |
| 2024 | $1,872 | $99,900 | $11,250 | $88,650 |
| 2022 | $1,879 | $100,300 | $11,250 | $89,050 |
| 2021 | $1,572 | $66,900 | $6,825 | $60,075 |
| 2020 | $1,572 | $66,900 | $6,825 | $60,075 |
| 2019 | $1,572 | $66,900 | $6,825 | $60,075 |
| 2018 | $1,572 | $66,900 | $6,825 | $60,075 |
| 2017 | $1,560 | $63,675 | $6,825 | $56,850 |
| 2016 | $1,369 | $63,675 | $6,825 | $56,850 |
| 2015 | $1,369 | $63,675 | $6,825 | $56,850 |
| 2014 | $1,369 | $63,675 | $6,825 | $56,850 |
Source: Public Records
Map
Nearby Homes
- 18 Shadow Ridge Dr
- 9 Shadow Ridge Dr
- 35 Eaglecrest
- 9 Windwood Dr
- 35 Hampstead Cove
- 100 Crest Ridge Dr
- 290 Redfield Dr
- 54 Laurelwood Cove
- 22 Deepwood Dr
- 4 Windwood Dr
- 812 Pipkin Rd
- 116 Rolling Hills Dr
- 465 Shadow Ridge Dr
- 115 Buckingham Cove
- 59 Larkson Ln
- 26 Bridlepath Dr
- 148 Bridlepath Dr
- 116 Ravenwood Dr
- 52 Buckingham Cove
- 9 Citrus Springs Cove
- 62 Shadow Ridge Dr
- 90 Shadow Ridge Dr
- 87 Shadow Ridge Dr
- 71 Shadow Ridge Dr
- 6 Mallard Creek Cove
- 20 Mallard Creek Cove
- 105 Shadow Ridge Dr
- 32 Mallard Creek Cove
- 47 Shadow Ridge Dr
- 36 Shadow Ridge Dr
- 451 Pipkin Rd
- 115 Shadow Ridge Dr
- 461 Pipkin Rd
- 40 Mallard Creek Cove
- 23 Sherburn Dr
- 9 Mallard Creek Cove
- 47 Greenpark Cove
- 25 Mallard Creek Cove
- 467 Pipkin Rd
- 475 Pipkin Rd
Your Personal Tour Guide
Ask me questions while you tour the home.