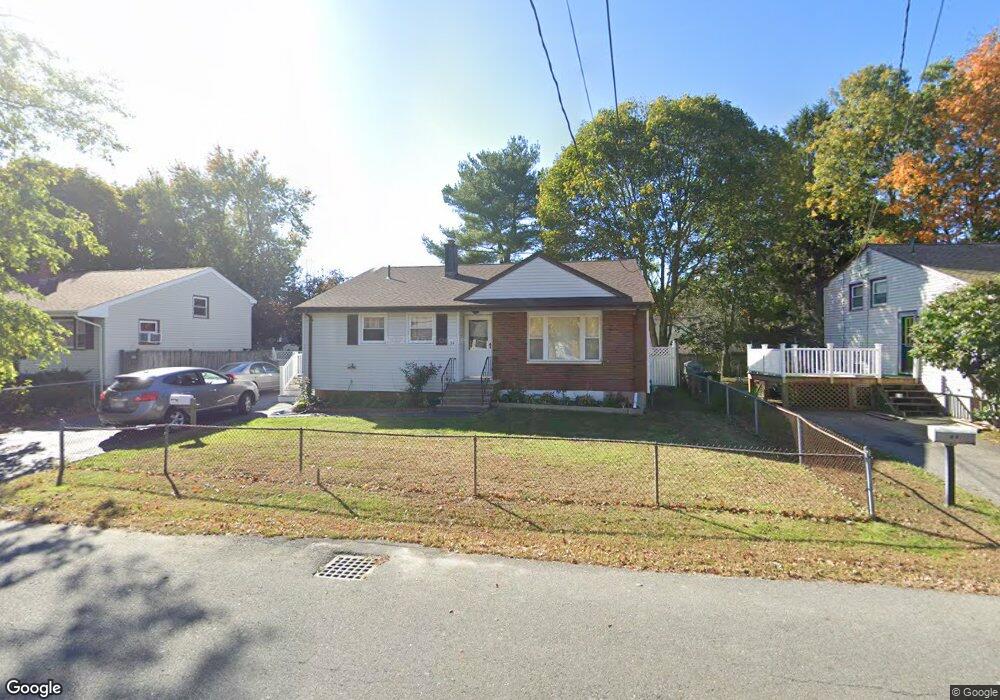
76 Sheridan St Brockton, MA 02302
Estimated Value: $461,722 - $581,000
3
Beds
1
Bath
1,314
Sq Ft
$393/Sq Ft
Est. Value
About This Home
This home is located at 76 Sheridan St, Brockton, MA 02302 and is currently estimated at $516,931, approximately $393 per square foot. 76 Sheridan St is a home located in Plymouth County with nearby schools including Brookfield Elementary School, Downey Elementary School, and Mary E. Baker Elementary School.
Ownership History
Date
Name
Owned For
Owner Type
Purchase Details
Closed on
Jul 23, 2002
Sold by
Lopes Rosa P
Bought by
Dumersaint Frantz and Dumersaint Michelance
Current Estimated Value
Home Financials for this Owner
Home Financials are based on the most recent Mortgage that was taken out on this home.
Original Mortgage
$172,000
Interest Rate
6.73%
Mortgage Type
Purchase Money Mortgage
Create a Home Valuation Report for This Property
The Home Valuation Report is an in-depth analysis detailing your home's value as well as a comparison with similar homes in the area
Purchase History
| Date | Buyer | Sale Price | Title Company |
|---|---|---|---|
| Dumersaint Frantz | $220,000 | -- |
Source: Public Records
Mortgage History
| Date | Status | Borrower | Loan Amount |
|---|---|---|---|
| Open | Dumersaint Frantz | $173,500 | |
| Closed | Dumersaint Frantz | $172,000 | |
| Previous Owner | Dumersaint Frantz | $51,500 |
Source: Public Records
Tax History
| Year | Tax Paid | Tax Assessment Tax Assessment Total Assessment is a certain percentage of the fair market value that is determined by local assessors to be the total taxable value of land and additions on the property. | Land | Improvement |
|---|---|---|---|---|
| 2025 | $4,771 | $394,000 | $143,800 | $250,200 |
| 2024 | $4,670 | $388,500 | $143,800 | $244,700 |
| 2023 | $4,557 | $351,100 | $108,500 | $242,600 |
| 2022 | $4,248 | $304,100 | $98,500 | $205,600 |
| 2021 | $3,827 | $263,900 | $90,500 | $173,400 |
| 2020 | $4,010 | $264,700 | $87,000 | $177,700 |
| 2019 | $3,835 | $246,800 | $80,200 | $166,600 |
| 2018 | $3,340 | $208,000 | $80,200 | $127,800 |
| 2017 | $3,027 | $188,000 | $80,200 | $107,800 |
| 2016 | $2,951 | $170,000 | $76,400 | $93,600 |
| 2015 | $2,955 | $162,800 | $76,400 | $86,400 |
| 2014 | $2,826 | $155,900 | $76,400 | $79,500 |
Source: Public Records
Map
Nearby Homes
- 149 Moncrief St
- 51 Sterling Rd
- 129 Anawan St
- 40 Austin Ct Unit Lot 3
- 383 Quincy St
- 13 Standish St
- 49 Martin St
- 43 Pinehurst Ave
- 2 Dundee St
- 34 Guild Rd
- 356 Crescent St
- 82 Debbie Rd Unit Lot 18
- 35 Errol Rd
- 60 Clara Rd
- 5 Debbie Rd
- 70 Pine St
- 111 Ames Rd
- 600 E Ashland St
- 146 Court St Unit 108
- 14 Emmet St
Your Personal Tour Guide
Ask me questions while you tour the home.