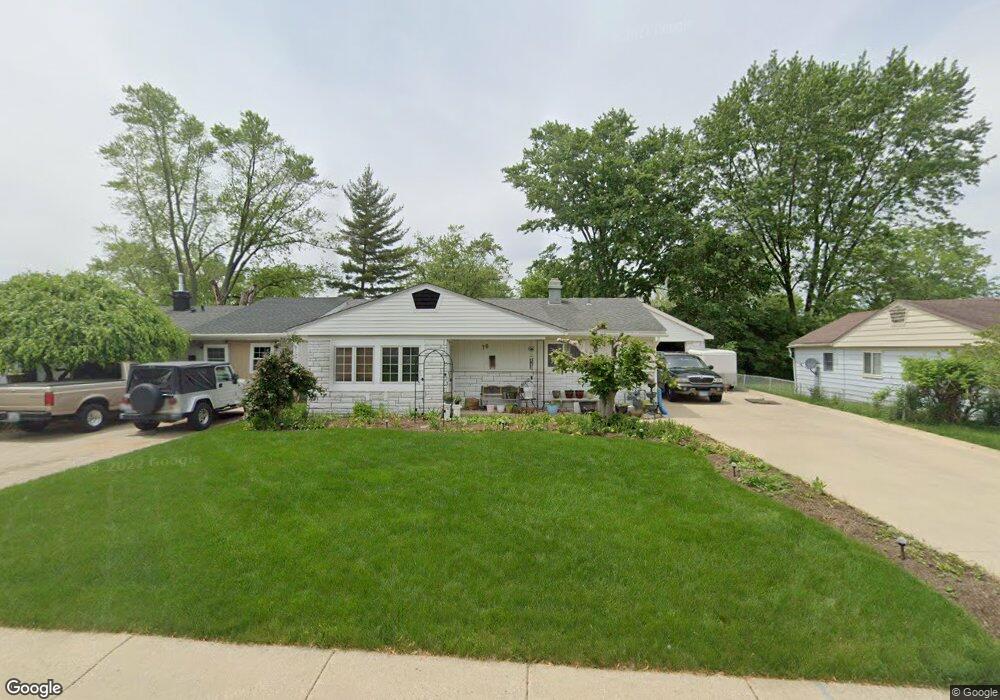
76 Sparrow Rd Carpentersville, IL 60110
Estimated Value: $255,177 - $279,000
3
Beds
--
Bath
1,388
Sq Ft
$193/Sq Ft
Est. Value
About This Home
This home is located at 76 Sparrow Rd, Carpentersville, IL 60110 and is currently estimated at $267,794, approximately $192 per square foot. 76 Sparrow Rd is a home located in Kane County with nearby schools including Meadowdale Elementary School, Crescent City Grade School, and Carpentersville Middle School.
Ownership History
Date
Name
Owned For
Owner Type
Purchase Details
Closed on
Apr 17, 1998
Sold by
Martinak Paul and Martinak Gloria C
Bought by
Ortiz Pablo and Ortiz Victor
Current Estimated Value
Home Financials for this Owner
Home Financials are based on the most recent Mortgage that was taken out on this home.
Original Mortgage
$100,205
Outstanding Balance
$18,721
Interest Rate
7.26%
Mortgage Type
FHA
Estimated Equity
$249,073
Purchase Details
Closed on
May 7, 1997
Sold by
Martinak Paul
Bought by
Martinak Paul and Martinak Gloria C
Create a Home Valuation Report for This Property
The Home Valuation Report is an in-depth analysis detailing your home's value as well as a comparison with similar homes in the area
Home Values in the Area
Average Home Value in this Area
Purchase History
| Date | Buyer | Sale Price | Title Company |
|---|---|---|---|
| Ortiz Pablo | $101,000 | Universal Title Services Inc | |
| Martinak Paul | -- | -- |
Source: Public Records
Mortgage History
| Date | Status | Borrower | Loan Amount |
|---|---|---|---|
| Open | Ortiz Pablo | $100,205 |
Source: Public Records
Tax History Compared to Growth
Tax History
| Year | Tax Paid | Tax Assessment Tax Assessment Total Assessment is a certain percentage of the fair market value that is determined by local assessors to be the total taxable value of land and additions on the property. | Land | Improvement |
|---|---|---|---|---|
| 2024 | $4,643 | $77,310 | $12,553 | $64,757 |
| 2023 | $4,500 | $69,561 | $11,295 | $58,266 |
| 2022 | $4,285 | $60,211 | $11,295 | $48,916 |
| 2021 | $4,154 | $56,851 | $10,665 | $46,186 |
| 2020 | $4,072 | $55,573 | $10,425 | $45,148 |
| 2019 | $3,951 | $52,756 | $9,897 | $42,859 |
| 2018 | $3,475 | $46,017 | $9,701 | $36,316 |
| 2017 | $3,287 | $43,047 | $9,075 | $33,972 |
| 2016 | $4,067 | $36,966 | $8,787 | $28,179 |
| 2015 | -- | $29,283 | $8,234 | $21,049 |
| 2014 | -- | $26,282 | $8,007 | $18,275 |
| 2013 | -- | $27,086 | $8,252 | $18,834 |
Source: Public Records
Map
Nearby Homes