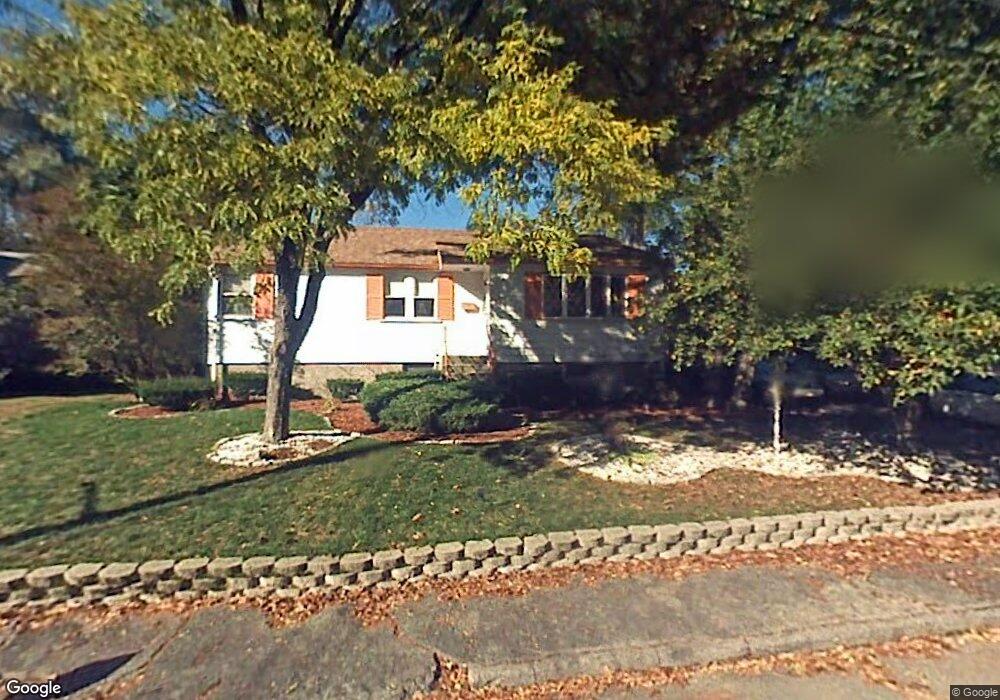
76 Thayer Cir Randolph, MA 02368
North Randolph NeighborhoodEstimated Value: $500,000 - $622,000
3
Beds
1
Bath
1,269
Sq Ft
$445/Sq Ft
Est. Value
About This Home
This home is located at 76 Thayer Cir, Randolph, MA 02368 and is currently estimated at $564,535, approximately $444 per square foot. 76 Thayer Cir is a home located in Norfolk County with nearby schools including Randolph High School, Boston Higashi School, and Lighthouse Baptist Christian Academy.
Ownership History
Date
Name
Owned For
Owner Type
Purchase Details
Closed on
Mar 7, 2022
Sold by
Cooper Sharon J
Bought by
Sharon J Cooper Ret
Current Estimated Value
Purchase Details
Closed on
May 4, 2021
Sold by
R & Beatrice C Cooper Irt
Bought by
Cooper Sharon J
Purchase Details
Closed on
Dec 15, 2008
Sold by
Cooper Robert and Cooper Beatrice C
Bought by
Robert&B Cooper Irt and Cooper Sharon J
Create a Home Valuation Report for This Property
The Home Valuation Report is an in-depth analysis detailing your home's value as well as a comparison with similar homes in the area
Home Values in the Area
Average Home Value in this Area
Purchase History
| Date | Buyer | Sale Price | Title Company |
|---|---|---|---|
| Sharon J Cooper Ret | -- | None Available | |
| Cooper Sharon J | -- | None Available | |
| Robert&B Cooper Irt | -- | -- |
Source: Public Records
Tax History Compared to Growth
Tax History
| Year | Tax Paid | Tax Assessment Tax Assessment Total Assessment is a certain percentage of the fair market value that is determined by local assessors to be the total taxable value of land and additions on the property. | Land | Improvement |
|---|---|---|---|---|
| 2025 | $5,634 | $485,300 | $247,600 | $237,700 |
| 2024 | $5,258 | $459,200 | $242,700 | $216,500 |
| 2023 | $5,194 | $430,000 | $220,600 | $209,400 |
| 2022 | $5,062 | $372,200 | $183,800 | $188,400 |
| 2021 | $4,978 | $336,800 | $153,200 | $183,600 |
| 2020 | $4,850 | $325,300 | $153,200 | $172,100 |
| 2019 | $4,656 | $310,800 | $146,000 | $164,800 |
| 2018 | $4,384 | $276,100 | $132,700 | $143,400 |
| 2017 | $4,231 | $261,500 | $126,300 | $135,200 |
| 2016 | $4,118 | $236,800 | $114,800 | $122,000 |
| 2015 | $4,009 | $221,500 | $109,400 | $112,100 |
Source: Public Records
Map
Nearby Homes
- 2 Smith Rd
- 229 Chestnut St
- 43 Emily Jeffers Rd
- 79 Gold St
- 16 Simmonds Blvd Unit 16
- 20 Simmonds Blvd Unit 20
- 14 Simmonds Blvd Unit 14
- 12 Simmonds Blvd Unit 12
- 68 High St
- 33 Michael Rd
- 34 Orchard St
- 591 N Main St
- 10 Michael Rd
- 7 Webster St
- 12 Webster St
- 18 Jasper Ln
- 12 Jasper Ln Unit 12
- 54 Jasper Ln
- 1 Clark Cir
- 33 Liberty St
- 80 Thayer Cir
- 72 Thayer Cir
- 51 Christopher Rd
- 75 Thayer Cir
- 45 Christopher Rd Unit 45
- 84 Thayer Cir
- 79 Thayer Cir
- 49 Christopher Rd
- 43 Christopher Rd Unit 45
- 68 Thayer Cir
- 39 Christopher Rd
- 41 Christopher Rd
- 83 Thayer Cir
- 88 Thayer Cir
- 64 Thayer Cir
- 11 Desmond Rd
- 13 Desmond Rd
- 55 Christopher Rd
- 53 Christopher Rd
- 53 Christopher Rd Unit 53