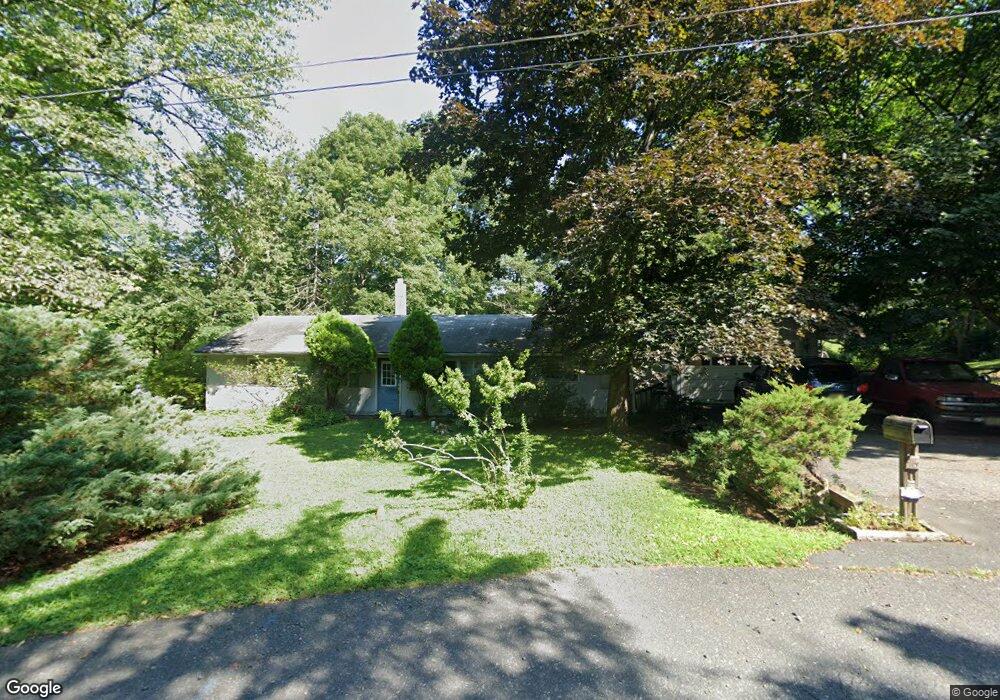
76 Valley View Rd High Bridge, NJ 08829
Estimated Value: $471,000 - $586,000
--
Bed
--
Bath
1,632
Sq Ft
$325/Sq Ft
Est. Value
About This Home
This home is located at 76 Valley View Rd, High Bridge, NJ 08829 and is currently estimated at $530,849, approximately $325 per square foot. 76 Valley View Rd is a home located in Hunterdon County with nearby schools including High Bridge Elementary School, High Bridge Middle School, and Voorhees High School.
Ownership History
Date
Name
Owned For
Owner Type
Purchase Details
Closed on
Aug 28, 2025
Sold by
Hunterdon County Sheriff
Bought by
Rcaf Acquisition Trust and Citigroup Mortgage Loan Trust
Current Estimated Value
Purchase Details
Closed on
Jul 20, 2004
Sold by
Drake Edward and Drake Carol
Bought by
Drake Edward
Home Financials for this Owner
Home Financials are based on the most recent Mortgage that was taken out on this home.
Original Mortgage
$209,000
Interest Rate
5.75%
Mortgage Type
New Conventional
Purchase Details
Closed on
Jul 30, 1999
Sold by
Conselina Anthony
Bought by
Drake Edward and Drake Carol
Home Financials for this Owner
Home Financials are based on the most recent Mortgage that was taken out on this home.
Original Mortgage
$152,900
Interest Rate
7.54%
Create a Home Valuation Report for This Property
The Home Valuation Report is an in-depth analysis detailing your home's value as well as a comparison with similar homes in the area
Home Values in the Area
Average Home Value in this Area
Purchase History
| Date | Buyer | Sale Price | Title Company |
|---|---|---|---|
| Rcaf Acquisition Trust | $366,263 | None Listed On Document | |
| Drake Edward | -- | Crossroads Title Services In | |
| Drake Edward | $169,900 | -- |
Source: Public Records
Mortgage History
| Date | Status | Borrower | Loan Amount |
|---|---|---|---|
| Previous Owner | Drake Edward | $209,000 | |
| Previous Owner | Drake Edward | $152,900 |
Source: Public Records
Tax History Compared to Growth
Tax History
| Year | Tax Paid | Tax Assessment Tax Assessment Total Assessment is a certain percentage of the fair market value that is determined by local assessors to be the total taxable value of land and additions on the property. | Land | Improvement |
|---|---|---|---|---|
| 2025 | $12,596 | $342,800 | $198,000 | $144,800 |
| 2024 | $12,870 | $385,900 | $162,200 | $223,700 |
| 2023 | $12,870 | $325,500 | $162,200 | $163,300 |
| 2022 | $10,914 | $256,500 | $143,000 | $113,500 |
| 2021 | $10,575 | $256,000 | $143,000 | $113,000 |
| 2020 | $10,496 | $256,000 | $143,000 | $113,000 |
| 2019 | $10,575 | $256,000 | $143,000 | $113,000 |
| 2018 | $10,181 | $256,900 | $143,000 | $113,900 |
| 2017 | $9,997 | $259,400 | $143,000 | $116,400 |
| 2016 | $9,881 | $259,400 | $143,000 | $116,400 |
| 2015 | $9,613 | $259,400 | $143,000 | $116,400 |
| 2014 | $12,039 | $351,100 | $191,500 | $159,600 |
Source: Public Records
Map
Nearby Homes