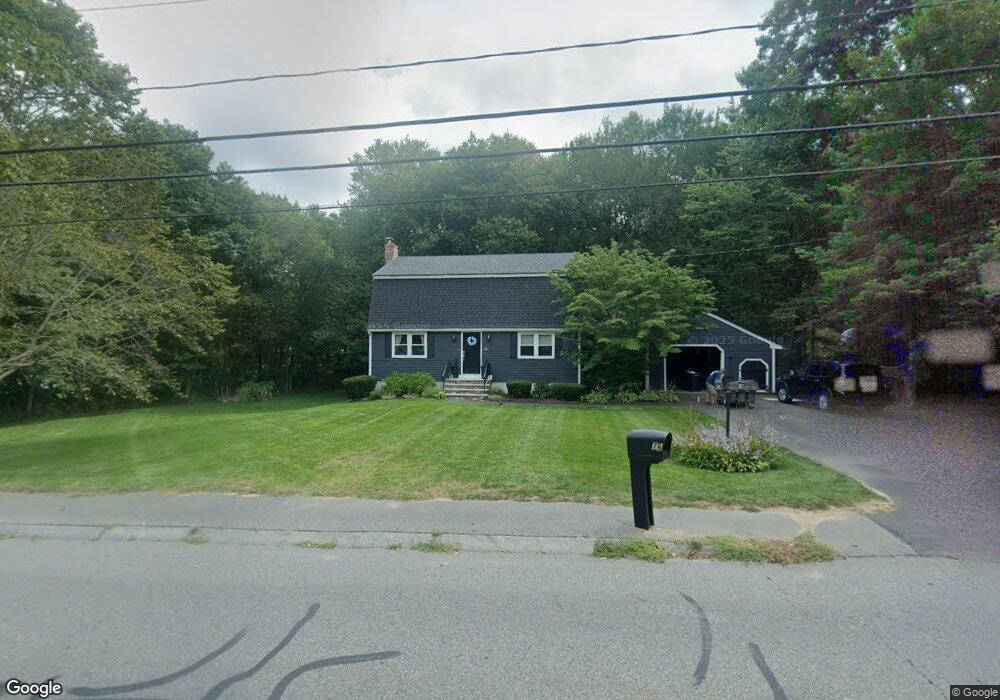
76 Vernon St Bridgewater, MA 02324
Estimated Value: $661,000 - $727,000
3
Beds
2
Baths
1,936
Sq Ft
$357/Sq Ft
Est. Value
About This Home
This home is located at 76 Vernon St, Bridgewater, MA 02324 and is currently estimated at $691,239, approximately $357 per square foot. 76 Vernon St is a home located in Plymouth County with nearby schools including Mitchell Elementary School, Williams Intermediate School, and Bridgewater Middle School.
Ownership History
Date
Name
Owned For
Owner Type
Purchase Details
Closed on
Dec 16, 2004
Sold by
Boughan Joseph F and Boughan Patricia M
Bought by
Omalley Sean C and Omalley Jennifer P
Current Estimated Value
Home Financials for this Owner
Home Financials are based on the most recent Mortgage that was taken out on this home.
Original Mortgage
$300,000
Interest Rate
5.68%
Mortgage Type
Purchase Money Mortgage
Purchase Details
Closed on
Jul 1, 1994
Sold by
Callahan William M and Callahan Jane E
Bought by
Bouchan Joseph F and Boughan Patricia M
Home Financials for this Owner
Home Financials are based on the most recent Mortgage that was taken out on this home.
Original Mortgage
$114,000
Interest Rate
8.19%
Create a Home Valuation Report for This Property
The Home Valuation Report is an in-depth analysis detailing your home's value as well as a comparison with similar homes in the area
Home Values in the Area
Average Home Value in this Area
Purchase History
| Date | Buyer | Sale Price | Title Company |
|---|---|---|---|
| Omalley Sean C | $385,000 | -- | |
| Bouchan Joseph F | $179,000 | -- |
Source: Public Records
Mortgage History
| Date | Status | Borrower | Loan Amount |
|---|---|---|---|
| Open | Bouchan Joseph F | $273,800 | |
| Closed | Bouchan Joseph F | $300,000 | |
| Previous Owner | Bouchan Joseph F | $122,000 | |
| Previous Owner | Bouchan Joseph F | $114,000 |
Source: Public Records
Tax History Compared to Growth
Tax History
| Year | Tax Paid | Tax Assessment Tax Assessment Total Assessment is a certain percentage of the fair market value that is determined by local assessors to be the total taxable value of land and additions on the property. | Land | Improvement |
|---|---|---|---|---|
| 2025 | $7,051 | $596,000 | $197,200 | $398,800 |
| 2024 | $6,749 | $555,900 | $187,800 | $368,100 |
| 2023 | $6,674 | $519,800 | $175,500 | $344,300 |
| 2022 | $6,587 | $460,000 | $154,000 | $306,000 |
| 2021 | $5,947 | $410,700 | $137,500 | $273,200 |
| 2020 | $5,731 | $389,100 | $132,200 | $256,900 |
| 2019 | $5,506 | $371,300 | $132,200 | $239,100 |
| 2018 | $5,336 | $351,300 | $128,400 | $222,900 |
| 2017 | $5,151 | $330,000 | $128,400 | $201,600 |
| 2016 | $4,923 | $316,800 | $125,900 | $190,900 |
| 2015 | $4,948 | $304,700 | $122,200 | $182,500 |
| 2014 | $4,843 | $298,000 | $118,600 | $179,400 |
Source: Public Records
Map
Nearby Homes
- 74 Vernon St
- 88 Boxwood Ln
- 54 Grange Park
- 165 Grange Park
- 8 North St
- 35 Stockbridge Rd
- 1442 Old Pleasant St
- 50 Stephanie Ln
- 1570 Old Pleasant St
- 331 North St
- 25 Twin Diamond Dr
- Lot 2 Fontana Way
- 905 Vernon St
- 10 College Rd
- 29 Saddle Dr
- 40 Country Club Dr
- 25 Evergreen Dr
- 489 Flagg St
- 220 Bedford St Unit D-5
- 74 Mount Prospect St