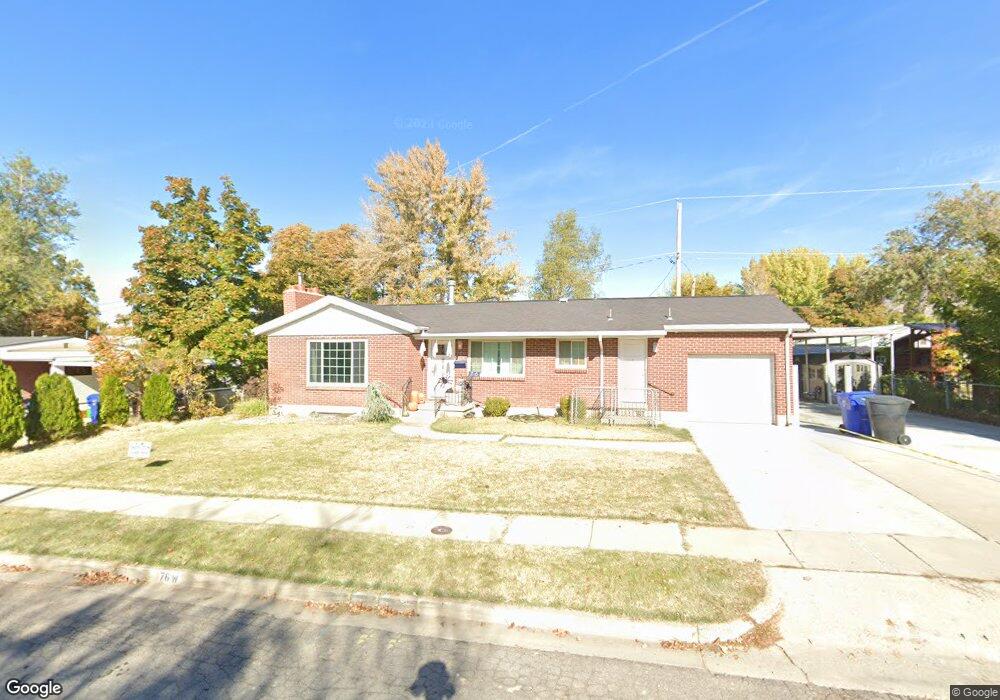
76 W 1300 S Bountiful, UT 84010
Estimated Value: $469,000 - $529,000
3
Beds
2
Baths
1,992
Sq Ft
$251/Sq Ft
Est. Value
About This Home
This home is located at 76 W 1300 S, Bountiful, UT 84010 and is currently estimated at $500,197, approximately $251 per square foot. 76 W 1300 S is a home located in Davis County with nearby schools including Bountiful Elementary School, Millcreek Junior High School, and Bountiful High School.
Ownership History
Date
Name
Owned For
Owner Type
Purchase Details
Closed on
May 29, 2024
Sold by
Gordon Stephen and Gordon Sarah
Bought by
Gordon
Current Estimated Value
Purchase Details
Closed on
Apr 27, 2017
Sold by
Fernelius Craig B and Fernelius Chera M
Bought by
Gordon Stepen K and Gordon Sarah A
Home Financials for this Owner
Home Financials are based on the most recent Mortgage that was taken out on this home.
Original Mortgage
$188,000
Interest Rate
4.14%
Mortgage Type
New Conventional
Purchase Details
Closed on
Jan 3, 2008
Sold by
Golightly Emajean Moser
Bought by
Fernilius Craig B and Fernilius Chera M
Home Financials for this Owner
Home Financials are based on the most recent Mortgage that was taken out on this home.
Original Mortgage
$195,925
Interest Rate
6.15%
Mortgage Type
FHA
Purchase Details
Closed on
Nov 26, 2001
Sold by
Golightly Emajean M
Bought by
Golightly Emajean Moser
Create a Home Valuation Report for This Property
The Home Valuation Report is an in-depth analysis detailing your home's value as well as a comparison with similar homes in the area
Purchase History
| Date | Buyer | Sale Price | Title Company |
|---|---|---|---|
| Gordon | -- | None Listed On Document | |
| Gordon Stepen K | -- | Vangurd Title | |
| Fernilius Craig B | -- | First American Title | |
| Golightly Emajean Moser | -- | -- |
Source: Public Records
Mortgage History
| Date | Status | Borrower | Loan Amount |
|---|---|---|---|
| Previous Owner | Gordon Stepen K | $188,000 | |
| Previous Owner | Fernilius Craig B | $195,925 |
Source: Public Records
Tax History
| Year | Tax Paid | Tax Assessment Tax Assessment Total Assessment is a certain percentage of the fair market value that is determined by local assessors to be the total taxable value of land and additions on the property. | Land | Improvement |
|---|---|---|---|---|
| 2025 | $2,688 | $245,300 | $119,363 | $125,937 |
| 2024 | -- | $237,051 | $103,065 | $133,986 |
| 2023 | $2,407 | $414,000 | $192,972 | $221,028 |
| 2022 | $2,399 | $226,051 | $106,288 | $119,763 |
| 2021 | $2,169 | $312,000 | $138,956 | $173,044 |
| 2020 | $1,914 | $276,000 | $119,846 | $156,154 |
| 2019 | $1,937 | $273,000 | $134,649 | $138,351 |
| 2018 | $1,803 | $250,000 | $132,179 | $117,821 |
| 2016 | $1,527 | $114,455 | $52,919 | $61,536 |
| 2015 | $1,502 | $106,315 | $52,919 | $53,396 |
| 2014 | $1,568 | $114,631 | $52,919 | $61,712 |
| 2013 | -- | $99,954 | $40,825 | $59,129 |
Source: Public Records
Map
Nearby Homes
- 1350 S 200 W
- 1314 S 200 W Unit 19
- 141 E 1650 S
- 190 W 1800 S
- 1795 S 200 W
- 1016 S 400 W
- 1820 S 50 W
- 650 S Main St Unit 7107
- 650 S Main St Unit 6206
- 650 S Main St Unit 4104
- 650 S Main St Unit 9106
- 545 S 100 E
- 1940 S 200 W Unit 3
- 380 E 1500 S
- 990 S 500 W
- 34 W 400 S
- 1950 S 200 W Unit 32
- 32 W 400 S
- 2 E Wicker Ln
- 323 Peach Ln
Your Personal Tour Guide
Ask me questions while you tour the home.