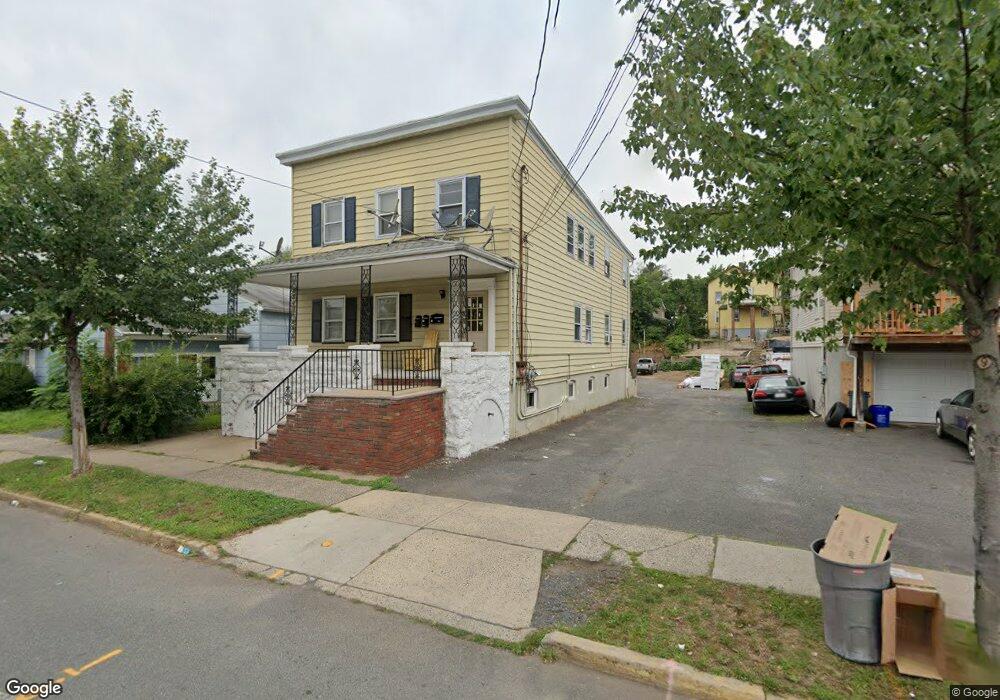
76 W 2nd St Bound Brook, NJ 08805
Estimated Value: $612,000 - $732,000
Studio
--
Bath
3,160
Sq Ft
$212/Sq Ft
Est. Value
About This Home
This home is located at 76 W 2nd St, Bound Brook, NJ 08805 and is currently estimated at $668,365, approximately $211 per square foot. 76 W 2nd St is a home located in Somerset County with nearby schools including LaMonte Annex Elementary School, Lafayette Elementary School, and Bound Brook High School.
Ownership History
Date
Name
Owned For
Owner Type
Purchase Details
Closed on
May 24, 2012
Sold by
Martinez Flavio and Martinez Marcos
Bought by
Martinez Marcos
Current Estimated Value
Purchase Details
Closed on
Sep 5, 2006
Sold by
Nimmo George P
Bought by
Martinez Flavio and Martinez Marcos
Home Financials for this Owner
Home Financials are based on the most recent Mortgage that was taken out on this home.
Original Mortgage
$320,000
Interest Rate
6.71%
Create a Home Valuation Report for This Property
The Home Valuation Report is an in-depth analysis detailing your home's value as well as a comparison with similar homes in the area
Home Values in the Area
Average Home Value in this Area
Purchase History
| Date | Buyer | Sale Price | Title Company |
|---|---|---|---|
| Martinez Marcos | -- | None Available | |
| Martinez Flavio | $400,000 | -- |
Source: Public Records
Mortgage History
| Date | Status | Borrower | Loan Amount |
|---|---|---|---|
| Previous Owner | Martinez Flavio | $320,000 |
Source: Public Records
Tax History
| Year | Tax Paid | Tax Assessment Tax Assessment Total Assessment is a certain percentage of the fair market value that is determined by local assessors to be the total taxable value of land and additions on the property. | Land | Improvement |
|---|---|---|---|---|
| 2025 | $12,872 | $596,900 | $250,000 | $346,900 |
| 2024 | $12,872 | $567,300 | $230,000 | $337,300 |
| 2023 | $12,717 | $539,300 | $210,000 | $329,300 |
| 2022 | $12,527 | $503,500 | $190,000 | $313,500 |
| 2021 | $10,773 | $416,400 | $130,000 | $286,400 |
| 2020 | $11,249 | $364,400 | $105,000 | $259,400 |
| 2019 | $10,773 | $332,800 | $95,000 | $237,800 |
| 2018 | $9,912 | $297,300 | $85,000 | $212,300 |
| 2017 | $9,919 | $290,800 | $85,000 | $205,800 |
| 2016 | $10,334 | $305,200 | $50,000 | $255,200 |
| 2015 | $11,052 | $333,800 | $60,000 | $273,800 |
| 2014 | $10,140 | $295,800 | $22,000 | $273,800 |
Source: Public Records
Map
Nearby Homes
Your Personal Tour Guide
Ask me questions while you tour the home.