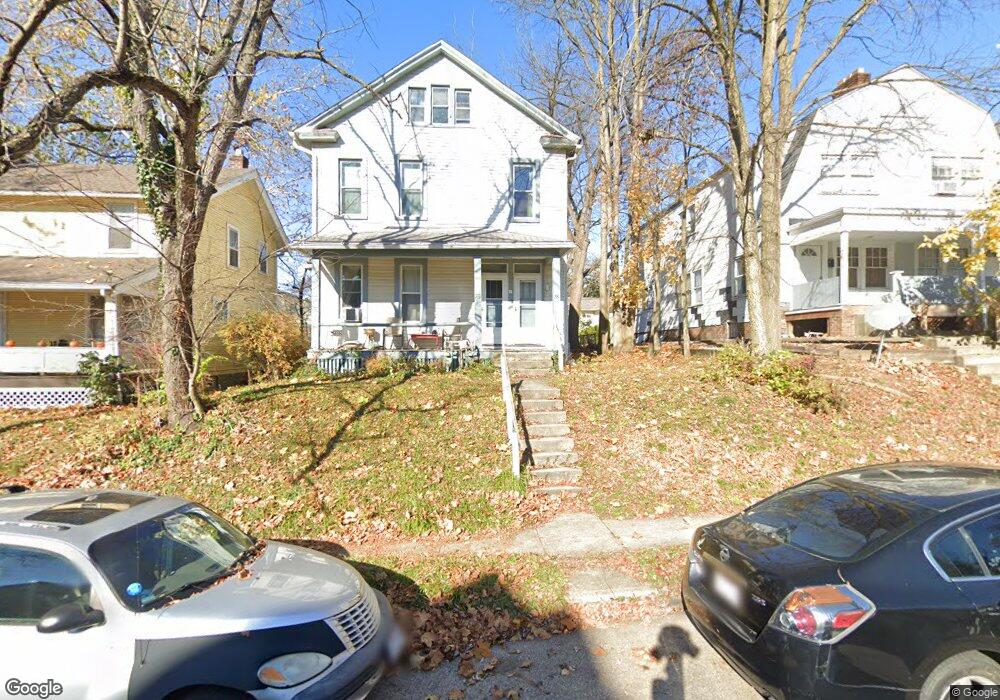
76 W Blake Ave Unit 78 Columbus, OH 43202
Old North Columbus NeighborhoodEstimated Value: $343,000 - $483,000
6
Beds
2
Baths
2,462
Sq Ft
$174/Sq Ft
Est. Value
About This Home
This home is located at 76 W Blake Ave Unit 78, Columbus, OH 43202 and is currently estimated at $428,031, approximately $173 per square foot. 76 W Blake Ave Unit 78 is a home located in Franklin County with nearby schools including Hubbard Elementary School, Dominion Middle School, and Whetstone High School.
Ownership History
Date
Name
Owned For
Owner Type
Purchase Details
Closed on
Dec 5, 2014
Sold by
Mendris Robert
Bought by
Bolzenius Sandra M
Current Estimated Value
Home Financials for this Owner
Home Financials are based on the most recent Mortgage that was taken out on this home.
Original Mortgage
$113,600
Outstanding Balance
$36,340
Interest Rate
3.91%
Mortgage Type
Stand Alone First
Estimated Equity
$391,691
Purchase Details
Closed on
Apr 6, 2001
Sold by
Vicinia Inc
Bought by
Mendris Robert and Mendrisova Helena
Home Financials for this Owner
Home Financials are based on the most recent Mortgage that was taken out on this home.
Original Mortgage
$86,400
Interest Rate
7.13%
Purchase Details
Closed on
Nov 7, 1974
Bought by
Vicinia Inc
Create a Home Valuation Report for This Property
The Home Valuation Report is an in-depth analysis detailing your home's value as well as a comparison with similar homes in the area
Home Values in the Area
Average Home Value in this Area
Purchase History
| Date | Buyer | Sale Price | Title Company |
|---|---|---|---|
| Bolzenius Sandra M | $142,000 | Amerititle | |
| Mendris Robert | $108,000 | Amerititle Agency Inc | |
| Vicinia Inc | -- | -- |
Source: Public Records
Mortgage History
| Date | Status | Borrower | Loan Amount |
|---|---|---|---|
| Open | Bolzenius Sandra M | $113,600 | |
| Previous Owner | Mendris Robert | $86,400 |
Source: Public Records
Tax History
| Year | Tax Paid | Tax Assessment Tax Assessment Total Assessment is a certain percentage of the fair market value that is determined by local assessors to be the total taxable value of land and additions on the property. | Land | Improvement |
|---|---|---|---|---|
| 2025 | $6,750 | $138,260 | $36,650 | $101,610 |
| 2024 | $6,750 | $147,290 | $36,650 | $110,640 |
| 2023 | $6,666 | $147,280 | $36,645 | $110,635 |
| 2022 | $5,232 | $98,460 | $27,480 | $70,980 |
| 2021 | $5,242 | $98,460 | $27,480 | $70,980 |
| 2020 | $5,250 | $98,460 | $27,480 | $70,980 |
| 2019 | $4,897 | $78,750 | $21,980 | $56,770 |
| 2018 | $3,807 | $78,750 | $21,980 | $56,770 |
| 2017 | $4,896 | $78,750 | $21,980 | $56,770 |
| 2016 | $3,030 | $44,420 | $18,550 | $25,870 |
| 2015 | $2,725 | $43,860 | $18,550 | $25,310 |
| 2014 | $2,682 | $43,860 | $18,550 | $25,310 |
| 2013 | $1,201 | $39,830 | $16,835 | $22,995 |
Source: Public Records
Map
Nearby Homes
- 102 W Tompkins St
- 2394 Neil Ave
- 2540 Neil Ave
- 6 E Blake Ave
- 2683 Neil Ave Unit 685
- 9 E Norwich Ave Unit 15
- 109 E Arcadia Ave
- 2537 Medary Ave Unit 539
- 53 Olentangy St
- 2458- 2458 1 2 Deming Ave
- 2362 Indiana Ave
- 2395 Summit St Unit 397
- 363 E Hudson St Unit 365
- 2680 Deming Ave
- 415 Glen Echo Cir
- 3021 N High St
- 2295 N 4th St
- 61 Tibet Rd
- 94 W Tulane Rd
- 2210-2212 N 4th St
- 70 W Blake Ave Unit 72
- 82 W Blake Ave
- 2466 Neil Ave
- 64 W Blake Ave Unit 66
- 88 W Blake Ave
- 66 W Blake Ave
- 2472 Neil Ave
- 56 W Blake Ave
- 64 Bucks Aly
- 2478 Neil Ave
- 69 W Blake Ave Unit 71
- 71 W Blake Ave
- 69 W Blake Ave
- 52 W Blake Ave Unit 54
- 50 Bucks Aly
- 77 W Blake Ave
- 91 W Blake Ave
- 2465 Neil Ave
- 85 W Blake Ave
- 102 W Blake Ave
Your Personal Tour Guide
Ask me questions while you tour the home.