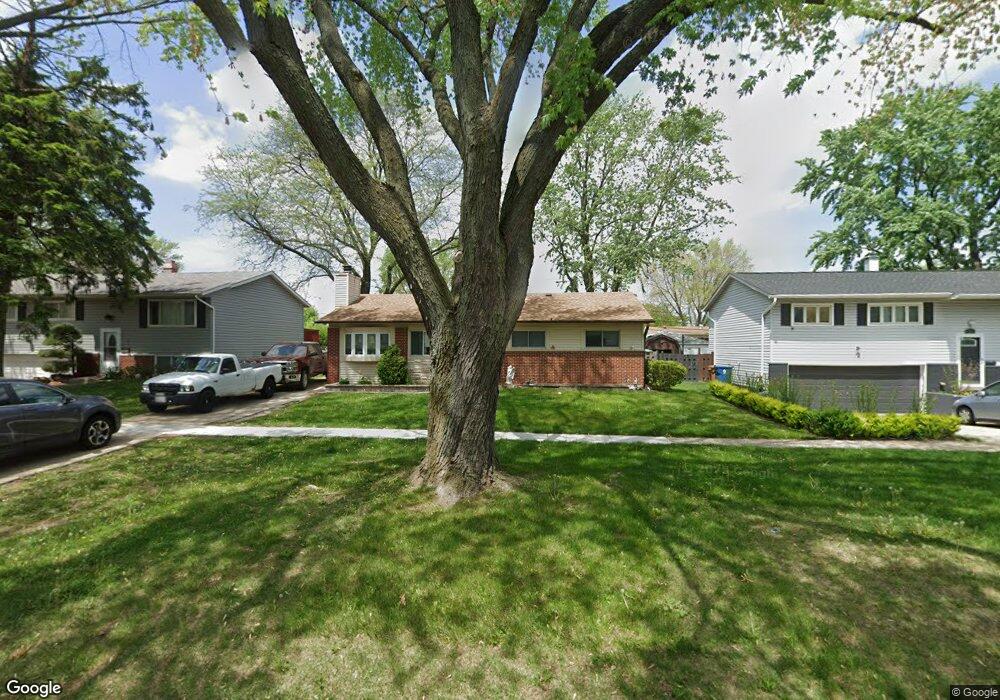
76 W Fullerton Ave Glendale Heights, IL 60139
Estimated Value: $320,000 - $352,000
3
Beds
1
Bath
1,276
Sq Ft
$258/Sq Ft
Est. Value
About This Home
This home is located at 76 W Fullerton Ave, Glendale Heights, IL 60139 and is currently estimated at $329,780, approximately $258 per square foot. 76 W Fullerton Ave is a home located in DuPage County with nearby schools including Americana Intermediate School, Glenside Middle School, and Glenbard North High School.
Ownership History
Date
Name
Owned For
Owner Type
Purchase Details
Closed on
Apr 5, 2022
Sold by
Marchan Alejandro S
Bought by
Marchan Alejandro S and Marchan Stefanie
Current Estimated Value
Purchase Details
Closed on
Jan 28, 2022
Sold by
Marchan Alejandro S
Bought by
Marchan Alejandro S and Marchan Stefanie
Purchase Details
Closed on
Jan 14, 2020
Sold by
Marchan Dawn
Bought by
Marchan Alejandro S and Marchan Rebecca
Purchase Details
Closed on
Sep 4, 2002
Sold by
Abernathy Diane
Bought by
Marchan Dawn
Purchase Details
Closed on
May 30, 2002
Sold by
Zell Carl R and Zell Patricia H
Bought by
Abernathy Diane
Home Financials for this Owner
Home Financials are based on the most recent Mortgage that was taken out on this home.
Original Mortgage
$152,000
Interest Rate
6.5%
Create a Home Valuation Report for This Property
The Home Valuation Report is an in-depth analysis detailing your home's value as well as a comparison with similar homes in the area
Home Values in the Area
Average Home Value in this Area
Purchase History
| Date | Buyer | Sale Price | Title Company |
|---|---|---|---|
| Marchan Alejandro S | -- | None Listed On Document | |
| Marchan Alejandro S | -- | Precision Title | |
| Marchan Alejandro S | -- | None Available | |
| Marchan Dawn | -- | -- | |
| Abernathy Diane | $160,000 | -- |
Source: Public Records
Mortgage History
| Date | Status | Borrower | Loan Amount |
|---|---|---|---|
| Previous Owner | Abernathy Diane | $152,000 |
Source: Public Records
Tax History Compared to Growth
Tax History
| Year | Tax Paid | Tax Assessment Tax Assessment Total Assessment is a certain percentage of the fair market value that is determined by local assessors to be the total taxable value of land and additions on the property. | Land | Improvement |
|---|---|---|---|---|
| 2024 | $6,727 | $81,531 | $23,346 | $58,185 |
| 2023 | $6,481 | $74,560 | $21,350 | $53,210 |
| 2022 | $5,328 | $59,100 | $20,180 | $38,920 |
| 2021 | $5,031 | $56,150 | $19,170 | $36,980 |
| 2020 | $4,837 | $54,780 | $18,700 | $36,080 |
| 2019 | $4,675 | $52,640 | $17,970 | $34,670 |
| 2018 | $5,249 | $52,670 | $17,500 | $35,170 |
| 2017 | $5,079 | $48,820 | $16,220 | $32,600 |
| 2016 | $4,870 | $45,180 | $15,010 | $30,170 |
| 2015 | $4,766 | $42,160 | $14,010 | $28,150 |
| 2014 | $4,765 | $41,850 | $13,700 | $28,150 |
| 2013 | $4,710 | $43,280 | $14,170 | $29,110 |
Source: Public Records
Map
Nearby Homes
- 56 N Golfview Ct
- 134 W Montana Ave
- 1500 Golfview Ct Unit 5
- 10 W Nevada Ave
- 1713 Schmale Rd
- 108 Golfview Dr
- 1760 Lombard Ct
- 1890 Harvest Ln
- 203 Ahmed Ct
- 200 Ahmed Ct
- 118 Windsor Ln
- 251 Polo Club Dr
- 2N643 Diane Ave
- 179 Glen Hill Dr
- 23W285 Armitage Ave
- 67 Stonefield Dr
- 367 Mark Ave
- 367 E Lincoln Ave
- 1188 Harbor Ct Unit 136
- 2N061 Bloomingdale Rd
- 72 W Fullerton Ave
- 80 W Fullerton Ave
- 77 W Montana Ave
- 84 W Fullerton Ave
- 66 W Fullerton Ave
- 73 W Montana Ave
- 81 W Montana Ave
- 85 W Montana Ave
- 67 W Montana Ave
- 90 W Fullerton Ave
- 62 W Fullerton Ave
- 91 W Montana Ave
- 79 W Fullerton Ave
- 71 W Fullerton Ave
- 63 W Montana Ave
- 75 W Fullerton Ave
- 65 W Fullerton Ave
- 94 W Fullerton Ave
- 56 W Fullerton Ave
- 57 W Montana Ave