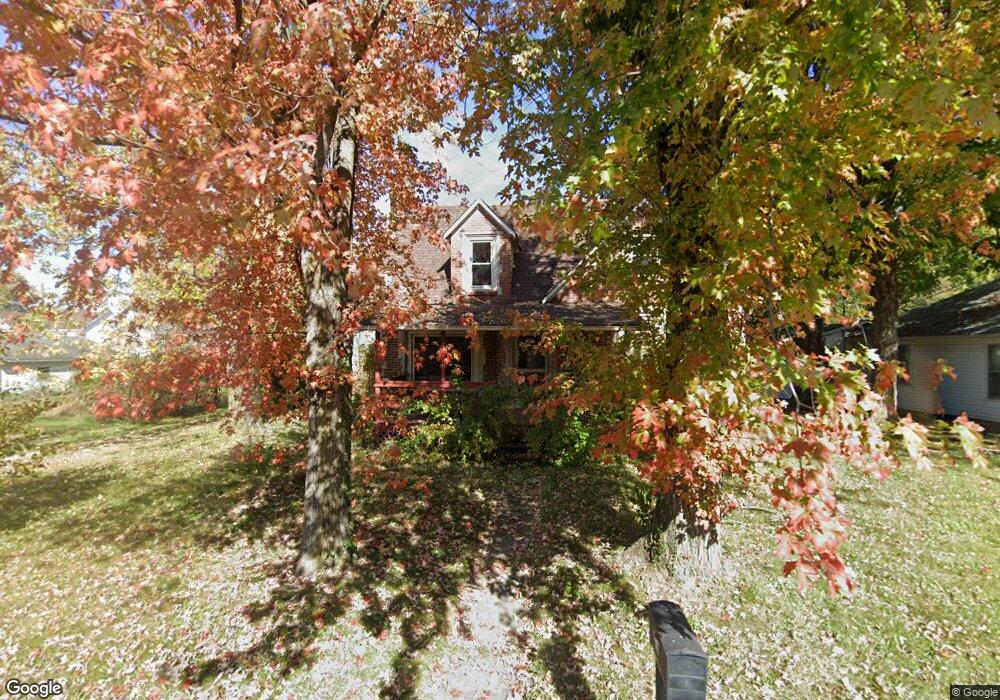
76 W Worman St Sheridan, IN 46069
Estimated Value: $280,992 - $393,000
4
Beds
2
Baths
2,706
Sq Ft
$122/Sq Ft
Est. Value
About This Home
This home is located at 76 W Worman St, Sheridan, IN 46069 and is currently estimated at $330,998, approximately $122 per square foot. 76 W Worman St is a home located in Hamilton County with nearby schools including Monon Trail Elementary School, Westfield Intermediate School, and Westfield Middle School.
Ownership History
Date
Name
Owned For
Owner Type
Purchase Details
Closed on
May 6, 2019
Sold by
Mccarty Vaun
Bought by
Duffer Michelle
Current Estimated Value
Purchase Details
Closed on
May 5, 2011
Sold by
Secretary Of Housing & Urban Development
Bought by
Mccarty Vaun
Purchase Details
Closed on
Apr 8, 2010
Sold by
Midfirst Bank
Bought by
Secretary Of Housing & Urban Development
Purchase Details
Closed on
Mar 30, 2009
Sold by
Turner Deborah K
Bought by
Blacketer Richard S
Purchase Details
Closed on
Oct 15, 2007
Sold by
Blacketer Richard S
Bought by
Turner Deborah K and Blacketer Richard S
Home Financials for this Owner
Home Financials are based on the most recent Mortgage that was taken out on this home.
Original Mortgage
$118,047
Interest Rate
6.47%
Mortgage Type
FHA
Create a Home Valuation Report for This Property
The Home Valuation Report is an in-depth analysis detailing your home's value as well as a comparison with similar homes in the area
Home Values in the Area
Average Home Value in this Area
Purchase History
| Date | Buyer | Sale Price | Title Company |
|---|---|---|---|
| Duffer Michelle | -- | Near North Title Group | |
| Mccarty Vaun | -- | None Available | |
| Secretary Of Housing & Urban Development | -- | None Available | |
| Midfirst Bank | $132,978 | None Available | |
| Blacketer Richard S | -- | None Available | |
| Turner Deborah K | -- | None Available | |
| Blacketer Richard S | -- | Chicago Title Insurance Co |
Source: Public Records
Mortgage History
| Date | Status | Borrower | Loan Amount |
|---|---|---|---|
| Previous Owner | Blacketer Richard S | $118,047 |
Source: Public Records
Tax History Compared to Growth
Tax History
| Year | Tax Paid | Tax Assessment Tax Assessment Total Assessment is a certain percentage of the fair market value that is determined by local assessors to be the total taxable value of land and additions on the property. | Land | Improvement |
|---|---|---|---|---|
| 2024 | $2,921 | $156,800 | $9,500 | $147,300 |
| 2023 | $2,936 | $148,900 | $9,500 | $139,400 |
| 2022 | $2,704 | $139,900 | $9,500 | $130,400 |
| 2021 | $2,508 | $117,900 | $9,500 | $108,400 |
| 2020 | $2,448 | $112,500 | $9,500 | $103,000 |
| 2019 | $1,022 | $112,500 | $9,500 | $103,000 |
| 2018 | $1,076 | $107,200 | $9,500 | $97,700 |
| 2017 | $878 | $101,500 | $9,500 | $92,000 |
| 2016 | $982 | $106,900 | $9,500 | $97,400 |
| 2014 | $1,038 | $105,700 | $9,500 | $96,200 |
| 2013 | $1,038 | $104,800 | $9,500 | $95,300 |
Source: Public Records
Map
Nearby Homes
- 78 Chatham Brook Dr
- Augusta Plan at Monon Corner - Destination Series
- Asheville Plan at Monon Corner - Destination Series
- Sarasota Plan at Monon Corner - Destination Series
- Sedona Plan at Monon Corner - Destination Series
- Scottsdale Plan at Monon Corner - Destination Series
- 139 Rock Island Rd
- Ironwood Plan at Monon Corner - Arbor Series
- Aspen II Plan at Monon Corner - Arbor Series
- Palmetto Plan at Monon Corner - Arbor Series
- Juniper Plan at Monon Corner - Arbor Series
- 151 Rock Island Rd
- 20451 Chatham Hills Blvd
- 20401 Atchison Way
- 1475 Old Hickory Ln
- 146 Chatham Bend Dr
- 20598 Chatham Creek Dr
- 109 Chatham Hills Blvd
- 20231 N Pacific Ave
- 20361 Hudson Bay Ln
- 20502 Baker St
- 20585 Horton Rd
- 71 W Worman St
- 20550 Baker St
- 20503 Baker St
- 20495 Horton Rd
- 20521 Baker St
- 55 W Worman St
- 77 W Worman St
- 3 W 206th St
- 52 E Worman St
- 41 E Worman St
- 20607 Horton Rd
- 0 W 206th St
- 0 W 206th St Unit MBR2208885
- 0 W 206th St Unit MBR2667458
- 0 W 206th St Unit MBR2623874
- 0 W 206th St Unit MBR2604852
- 0 W 206th St Unit MBR2216010
- 0 W 206th St Unit 21711262