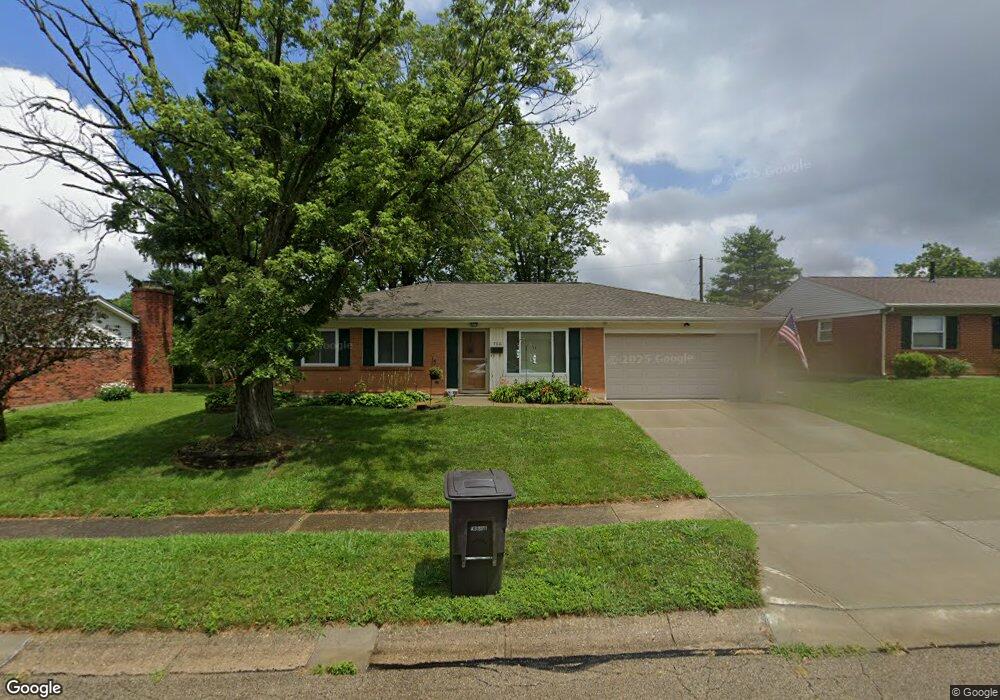
760 Arenel Dr Dayton, OH 45449
Estimated Value: $206,000 - $254,000
3
Beds
2
Baths
1,416
Sq Ft
$161/Sq Ft
Est. Value
About This Home
This home is located at 760 Arenel Dr, Dayton, OH 45449 and is currently estimated at $228,071, approximately $161 per square foot. 760 Arenel Dr is a home located in Montgomery County with nearby schools including West Carrollton High School and Bethel Baptist School.
Ownership History
Date
Name
Owned For
Owner Type
Purchase Details
Closed on
Dec 27, 2013
Sold by
Kniceley Todd E and Kniceley Danay M
Bought by
Brogan Dawn
Current Estimated Value
Home Financials for this Owner
Home Financials are based on the most recent Mortgage that was taken out on this home.
Original Mortgage
$58,000
Outstanding Balance
$43,770
Interest Rate
4.38%
Mortgage Type
Future Advance Clause Open End Mortgage
Estimated Equity
$184,301
Purchase Details
Closed on
Jan 30, 2007
Sold by
Luck Jamie A
Bought by
Kniceley Todd E and Kniceley Danay M
Home Financials for this Owner
Home Financials are based on the most recent Mortgage that was taken out on this home.
Original Mortgage
$118,000
Interest Rate
6.27%
Mortgage Type
Purchase Money Mortgage
Purchase Details
Closed on
Sep 19, 2000
Sold by
Marler Cameron L and Marler Candi M
Bought by
Luck Jamie A
Home Financials for this Owner
Home Financials are based on the most recent Mortgage that was taken out on this home.
Original Mortgage
$102,198
Interest Rate
7.99%
Mortgage Type
FHA
Create a Home Valuation Report for This Property
The Home Valuation Report is an in-depth analysis detailing your home's value as well as a comparison with similar homes in the area
Home Values in the Area
Average Home Value in this Area
Purchase History
| Date | Buyer | Sale Price | Title Company |
|---|---|---|---|
| Brogan Dawn | $104,000 | Gw Land Title Ltd | |
| Kniceley Todd E | $128,000 | Attorney | |
| Luck Jamie A | $102,300 | -- |
Source: Public Records
Mortgage History
| Date | Status | Borrower | Loan Amount |
|---|---|---|---|
| Open | Brogan Dawn | $58,000 | |
| Previous Owner | Kniceley Todd E | $118,000 | |
| Previous Owner | Luck Jamie A | $102,198 |
Source: Public Records
Tax History Compared to Growth
Tax History
| Year | Tax Paid | Tax Assessment Tax Assessment Total Assessment is a certain percentage of the fair market value that is determined by local assessors to be the total taxable value of land and additions on the property. | Land | Improvement |
|---|---|---|---|---|
| 2024 | $3,470 | $57,420 | $7,780 | $49,640 |
| 2023 | $3,470 | $57,420 | $7,780 | $49,640 |
| 2022 | $3,089 | $40,150 | $5,440 | $34,710 |
| 2021 | $3,094 | $40,150 | $5,440 | $34,710 |
| 2020 | $3,095 | $40,150 | $5,440 | $34,710 |
| 2019 | $2,866 | $34,330 | $4,740 | $29,590 |
| 2018 | $2,682 | $34,330 | $4,740 | $29,590 |
| 2017 | $2,663 | $34,330 | $4,740 | $29,590 |
| 2016 | $2,453 | $30,820 | $4,740 | $26,080 |
| 2015 | $2,251 | $30,820 | $4,740 | $26,080 |
| 2014 | $2,251 | $30,820 | $4,740 | $26,080 |
| 2012 | -- | $35,760 | $9,190 | $26,570 |
Source: Public Records
Map
Nearby Homes
- 758 Cransberry Dr
- 250 Grantwood Dr
- 257 Ironwood Dr
- 860 Mardel Dr
- 624 Skyview Dr
- 00 Heincke Rd
- 00 Graceland Dr
- 1000 Skyview Dr
- 765 Heincke Rd
- 429 Wilson Park Dr
- 26 Southard Ln
- 201 S Smith St
- 203 W Pease Ave Unit 205
- 21 W Main St
- 1803 Cudgell Dr
- 12 E Main St
- 1100 S Elm St
- 2125 Sherwood Forest Dr
- 1109 Sundance Dr
- 509 Windsor Ave