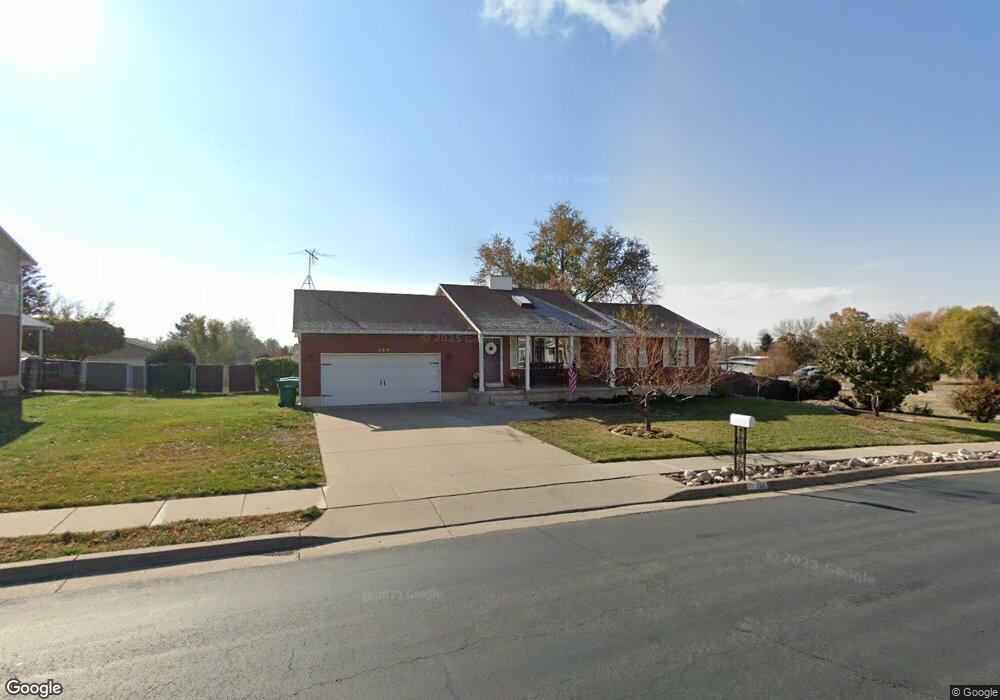
760 Aspen Way Layton, UT 84040
Estimated Value: $457,000 - $501,000
3
Beds
2
Baths
1,880
Sq Ft
$259/Sq Ft
Est. Value
About This Home
This home is located at 760 Aspen Way, Layton, UT 84040 and is currently estimated at $486,895, approximately $258 per square foot. 760 Aspen Way is a home located in Davis County with nearby schools including King Elementary School, Central Davis Junior High School, and Layton High School.
Ownership History
Date
Name
Owned For
Owner Type
Purchase Details
Closed on
Dec 3, 2019
Sold by
Patterson Jacob and Patterson Isabel C
Bought by
Soelberg Nathan S and Soelberg Alexis B
Current Estimated Value
Home Financials for this Owner
Home Financials are based on the most recent Mortgage that was taken out on this home.
Original Mortgage
$221,600
Outstanding Balance
$195,529
Interest Rate
3.75%
Mortgage Type
New Conventional
Estimated Equity
$291,366
Purchase Details
Closed on
May 4, 2016
Sold by
Patterson Jacob
Bought by
Patterson Isabel C and Patterson Jacob
Purchase Details
Closed on
Nov 10, 2006
Sold by
Conrad Lougene K
Bought by
Conrad Lougene K and Lougene K Conrad Trust
Purchase Details
Closed on
Jun 26, 2006
Sold by
Adams Richard R and Brockbank Alison
Bought by
Conrad Lougene K
Purchase Details
Closed on
Dec 19, 2005
Sold by
Brockbank Marilyn A and Brockbank Marilyn
Bought by
Adams Richard R and Brockbank Alison
Create a Home Valuation Report for This Property
The Home Valuation Report is an in-depth analysis detailing your home's value as well as a comparison with similar homes in the area
Home Values in the Area
Average Home Value in this Area
Purchase History
| Date | Buyer | Sale Price | Title Company |
|---|---|---|---|
| Soelberg Nathan S | -- | Backman Title Services | |
| Patterson Isabel C | -- | Backman Title Services | |
| Patterson Jacob | -- | Backman Title Services | |
| Conrad Lougene K | -- | None Available | |
| Conrad Lougene K | -- | The Talon Group | |
| Adams Richard R | -- | -- |
Source: Public Records
Mortgage History
| Date | Status | Borrower | Loan Amount |
|---|---|---|---|
| Open | Soelberg Nathan S | $221,600 |
Source: Public Records
Tax History Compared to Growth
Tax History
| Year | Tax Paid | Tax Assessment Tax Assessment Total Assessment is a certain percentage of the fair market value that is determined by local assessors to be the total taxable value of land and additions on the property. | Land | Improvement |
|---|---|---|---|---|
| 2025 | $2,384 | $250,250 | $155,779 | $94,471 |
| 2024 | $2,283 | $241,450 | $173,294 | $68,156 |
| 2023 | $2,259 | $421,000 | $221,539 | $199,461 |
| 2022 | $2,380 | $240,900 | $119,875 | $121,025 |
| 2021 | $2,047 | $309,000 | $184,118 | $124,882 |
| 2020 | $1,844 | $267,000 | $155,936 | $111,064 |
| 2019 | $1,805 | $256,000 | $137,793 | $118,207 |
| 2018 | $1,636 | $233,000 | $112,779 | $120,221 |
| 2016 | $1,497 | $109,945 | $58,191 | $51,754 |
| 2015 | $1,436 | $100,155 | $58,191 | $41,964 |
| 2014 | $251 | $103,862 | $58,191 | $45,671 |
| 2013 | -- | $90,590 | $24,875 | $65,715 |
Source: Public Records
Map
Nearby Homes
- 861 E 575 N
- 857 E 575 N
- 556 N Fairfield Rd Unit A2
- 556 N Fairfield Rd Unit D1
- 556 N Fairfield Rd Unit D2
- 556 N Fairfield Rd Unit A3
- 556 N Fairfield Rd Unit D3
- 556 N Fairfield Rd Unit D4
- 556 N Fairfield Rd Unit A1
- 556 N Fairfield Rd Unit A4
- 654 Colonial St
- 508 N Adamswood Rd
- 794 Valeria Dr
- 580 N Allanwood Place
- 880 E 350 N
- 785 Sherwood Dr
- 479 N 1375 E
- 1503 E 530 N
- 1122 E 1250 N
- 1247 E 300 N
- 768 Aspen Way
- 768 Aspen Way Unit 55
- 751 Aspen Way
- 777 N Adamswood Rd
- 908 E 775 N
- 902 E 775 N
- 773 Aspen Way
- 719 N Snowcreek Cir
- 764 N Fairfield Rd
- 768 N Fairfield Rd
- 772 N Fairfield Rd
- 771 N Adamswood Rd
- 680 N Tenkids Way
- 913 E 775 N
- 774 N Fairfield Rd
- 707 N Snowcreek Cir
- 907 E 775 N
- 903 E 775 N
- 796 N Fairfield Rd
- 780 N Fairfield Rd