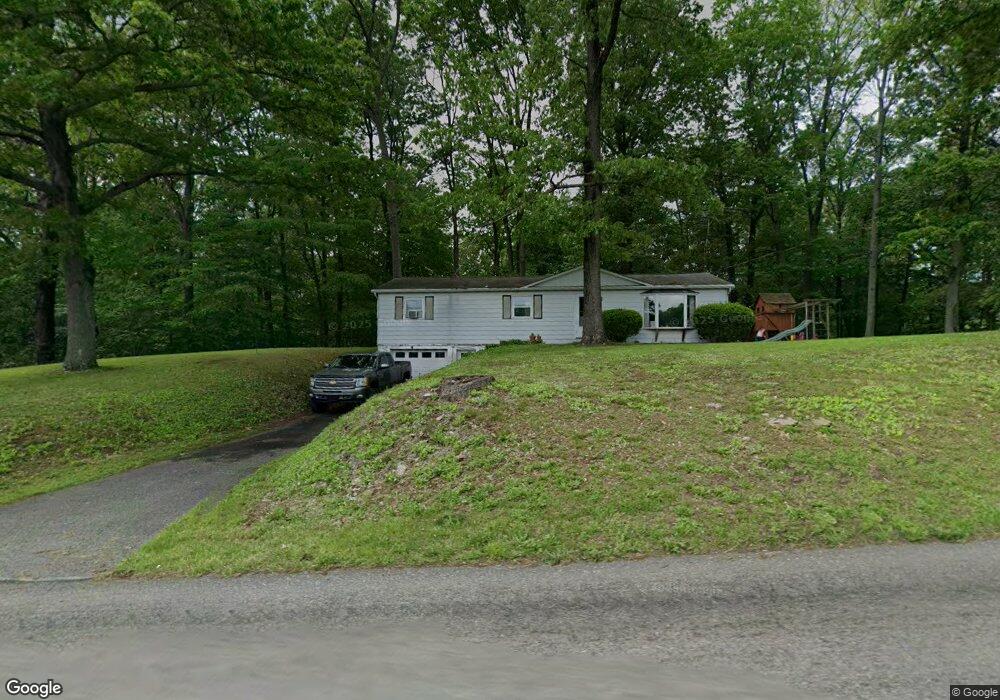
760 Dry Wells Rd Quarryville, PA 17566
Estimated Value: $473,690 - $618,000
3
Beds
2
Baths
1,869
Sq Ft
$291/Sq Ft
Est. Value
About This Home
This home is located at 760 Dry Wells Rd, Quarryville, PA 17566 and is currently estimated at $543,673, approximately $290 per square foot. 760 Dry Wells Rd is a home located in Lancaster County with nearby schools including Solanco High School.
Ownership History
Date
Name
Owned For
Owner Type
Purchase Details
Closed on
Aug 15, 2019
Sold by
Glick Fannie S
Bought by
Esch Samuel M
Current Estimated Value
Home Financials for this Owner
Home Financials are based on the most recent Mortgage that was taken out on this home.
Original Mortgage
$388,860
Outstanding Balance
$340,569
Interest Rate
3.7%
Mortgage Type
Purchase Money Mortgage
Estimated Equity
$203,104
Purchase Details
Closed on
May 20, 2018
Sold by
Glick Isaac Esh and Glick Fannie S
Bought by
Glick Fannie S
Purchase Details
Closed on
Jul 26, 2007
Sold by
Dillon Barbara Reist
Bought by
Glick Isaac Esh and Glick Fannie S
Home Financials for this Owner
Home Financials are based on the most recent Mortgage that was taken out on this home.
Original Mortgage
$168,000
Interest Rate
6.67%
Mortgage Type
Purchase Money Mortgage
Create a Home Valuation Report for This Property
The Home Valuation Report is an in-depth analysis detailing your home's value as well as a comparison with similar homes in the area
Home Values in the Area
Average Home Value in this Area
Purchase History
| Date | Buyer | Sale Price | Title Company |
|---|---|---|---|
| Esch Samuel M | $375,000 | None Available | |
| Glick Fannie S | -- | None Available | |
| Glick Isaac Esh | $250,000 | None Available |
Source: Public Records
Mortgage History
| Date | Status | Borrower | Loan Amount |
|---|---|---|---|
| Open | Esch Samuel M | $388,860 | |
| Previous Owner | Glick Isaac Esh | $168,000 |
Source: Public Records
Tax History Compared to Growth
Tax History
| Year | Tax Paid | Tax Assessment Tax Assessment Total Assessment is a certain percentage of the fair market value that is determined by local assessors to be the total taxable value of land and additions on the property. | Land | Improvement |
|---|---|---|---|---|
| 2025 | $4,626 | $283,600 | $96,700 | $186,900 |
| 2024 | $4,626 | $283,600 | $96,700 | $186,900 |
| 2023 | $4,483 | $283,600 | $96,700 | $186,900 |
| 2022 | $4,341 | $283,600 | $96,700 | $186,900 |
| 2021 | $4,165 | $283,600 | $96,700 | $186,900 |
| 2020 | $4,117 | $280,300 | $96,700 | $183,600 |
| 2019 | $4,014 | $280,300 | $96,700 | $183,600 |
| 2018 | $1,077 | $280,300 | $96,700 | $183,600 |
| 2017 | $3,888 | $224,300 | $63,900 | $160,400 |
| 2016 | $3,866 | $224,300 | $63,900 | $160,400 |
| 2015 | $1,073 | $224,300 | $63,900 | $160,400 |
| 2014 | $2,575 | $224,300 | $63,900 | $160,400 |
Source: Public Records
Map
Nearby Homes
- 161 Groff Rd
- 46 Rineer Dr
- 261 Meadow Ln
- 403 S Summit Ave
- 150 Marlton Ln
- 232 Circle Dr
- 110 Dawn St
- 620 S Smith Dr Unit (FLETCHER)
- 620 S Smith Dr Unit (NORWAY)
- 620 S Smith Dr Unit (DOUGLAS)
- 620 S Smith Dr Unit (JUNIPER)
- 620 S Smith Dr Unit (HEMLOCK)
- 620 S Smith Dr Unit (BALSAM)
- 326 W Fritz Ave
- 328 W Fritz Ave
- 330 W Fritz Ave
- 332 W Fritz Ave
- 338 W Fritz Ave
- 327 W Fritz Ave
- 329 W Fritz Ave
- 782 Dry Wells Rd
- 792 Dry Wells Rd
- 766 Dry Wells Rd
- 147 Bushong Rd
- 118 Bushong Rd
- 128 Bushong Rd
- 139 Bushong Rd
- 116 Bushong Rd
- 159 Bushong Rd
- 224 Pumping Station Rd
- 109 Bushong Rd
- 692 Dry Wells Rd
- 262 Pumping Station Rd
- 685 Dry Wells Rd
- 684 Dry Wells Rd
- 309 Pumping Station Rd
- 676 Dry Wells Rd
- 91 Bushong Rd
- 149 Pumping Station Rd
- 25 Skyview Dr