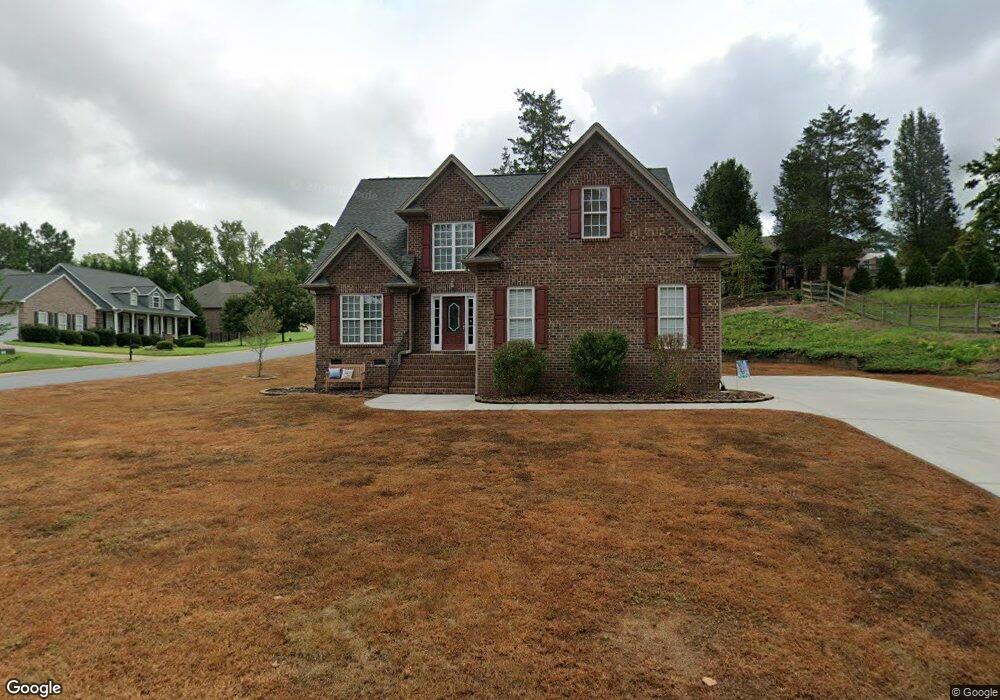
760 Endell St Denver, NC 28037
Estimated Value: $452,000 - $558,000
3
Beds
3
Baths
2,020
Sq Ft
$243/Sq Ft
Est. Value
About This Home
This home is located at 760 Endell St, Denver, NC 28037 and is currently estimated at $490,213, approximately $242 per square foot. 760 Endell St is a home located in Lincoln County with nearby schools including Catawba Springs Elementary School, East Lincoln Middle School, and East Lincoln High School.
Ownership History
Date
Name
Owned For
Owner Type
Purchase Details
Closed on
Oct 7, 2009
Sold by
Haymore Douglas Gene and Haymore Mary Katherine
Bought by
Haymore Douglas Gene and Haymore Mary Katherine
Current Estimated Value
Home Financials for this Owner
Home Financials are based on the most recent Mortgage that was taken out on this home.
Original Mortgage
$256,900
Outstanding Balance
$167,923
Interest Rate
5.1%
Mortgage Type
New Conventional
Estimated Equity
$322,290
Purchase Details
Closed on
Jun 28, 2007
Sold by
Sci Homes Inc
Bought by
Haymore Douglas Gene and Hancock Mary Katherine
Home Financials for this Owner
Home Financials are based on the most recent Mortgage that was taken out on this home.
Original Mortgage
$257,500
Interest Rate
6.37%
Mortgage Type
New Conventional
Purchase Details
Closed on
Sep 15, 2006
Sold by
D Ballard Contruction Inc
Bought by
Sci Homes Inc
Purchase Details
Closed on
May 21, 2003
Bought by
D Ballard Construction Inc
Create a Home Valuation Report for This Property
The Home Valuation Report is an in-depth analysis detailing your home's value as well as a comparison with similar homes in the area
Purchase History
| Date | Buyer | Sale Price | Title Company |
|---|---|---|---|
| Haymore Douglas Gene | -- | Lsi Lps | |
| Haymore Douglas Gene | $258,000 | None Available | |
| Sci Homes Inc | $33,000 | None Available | |
| D Ballard Construction Inc | $104,000 | -- |
Source: Public Records
Mortgage History
| Date | Status | Borrower | Loan Amount |
|---|---|---|---|
| Open | Haymore Douglas Gene | $256,900 | |
| Closed | Haymore Douglas Gene | $257,500 |
Source: Public Records
Tax History
| Year | Tax Paid | Tax Assessment Tax Assessment Total Assessment is a certain percentage of the fair market value that is determined by local assessors to be the total taxable value of land and additions on the property. | Land | Improvement |
|---|---|---|---|---|
| 2025 | $2,463 | $384,526 | $50,000 | $334,526 |
| 2024 | $2,433 | $384,526 | $50,000 | $334,526 |
| 2023 | $2,428 | $384,526 | $50,000 | $334,526 |
| 2022 | $1,849 | $234,687 | $40,000 | $194,687 |
| 2021 | $1,861 | $234,687 | $40,000 | $194,687 |
| 2020 | $1,636 | $234,687 | $40,000 | $194,687 |
| 2019 | $1,636 | $234,687 | $40,000 | $194,687 |
| 2018 | $1,635 | $219,186 | $38,500 | $180,686 |
| 2017 | $1,534 | $219,186 | $38,500 | $180,686 |
| 2016 | $1,528 | $219,186 | $38,500 | $180,686 |
| 2015 | $1,651 | $219,186 | $38,500 | $180,686 |
| 2014 | $1,629 | $225,401 | $44,500 | $180,901 |
Source: Public Records
Map
Nearby Homes
- 7633 Tanglewood Way
- 8095 Woodline Ln
- 387 Lancashire Ct
- 391 Lancashire Ct
- Plan 1445 at Bella Vista - Classic
- Plan 1582 Modeled at Bella Vista - Classic
- Plan 2340 at Bella Vista - Heritage
- Plan 3147 at Bella Vista - Classic
- Plan 2540 at Bella Vista - Heritage
- Plan 2539 at Bella Vista - Classic
- Plan 2723 at Bella Vista - Heritage
- Plan 2338 Modeled at Bella Vista - Classic
- Plan 2539 at Bella Vista - Heritage
- Plan 2338 Modeled at Bella Vista - Heritage
- Plan 2723 at Bella Vista - Classic
- Plan 2115 at Bella Vista - Heritage
- Plan 1582 Modeled at Bella Vista - Heritage
- Plan 3147 at Bella Vista - Heritage
- Plan 2724 at Bella Vista - Heritage
- Plan 2939 at Bella Vista - Heritage
Your Personal Tour Guide
Ask me questions while you tour the home.