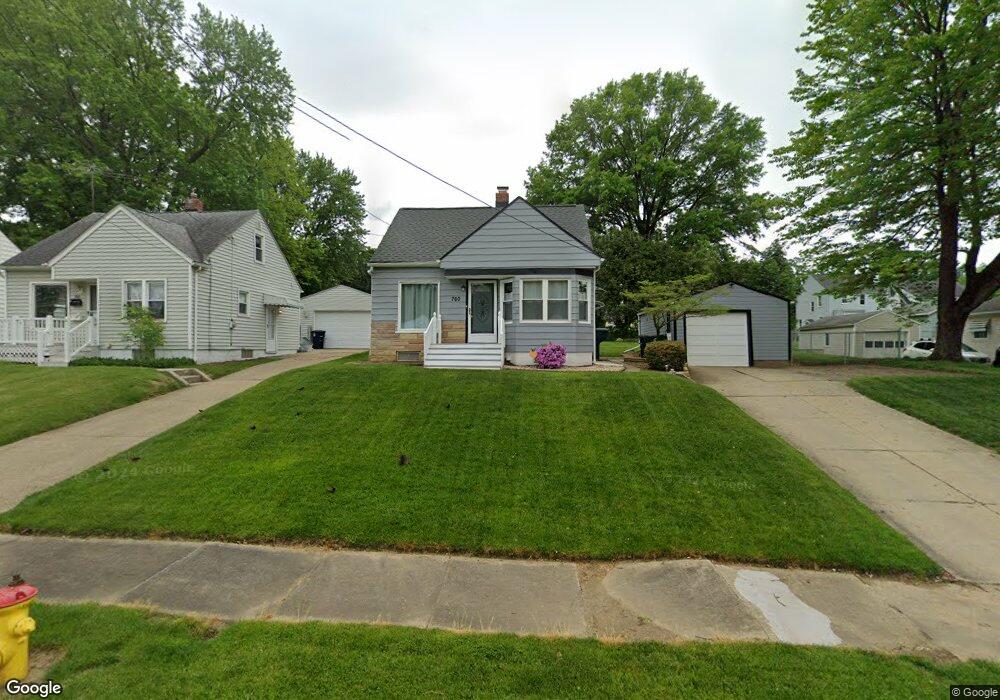
760 Marie Ave Akron, OH 44314
Kenmore NeighborhoodEstimated Value: $75,000 - $104,000
2
Beds
1
Bath
600
Sq Ft
$151/Sq Ft
Est. Value
About This Home
This home is located at 760 Marie Ave, Akron, OH 44314 and is currently estimated at $90,667, approximately $151 per square foot. 760 Marie Ave is a home located in Summit County with nearby schools including Pfeiffer Elementary School, Kenmore Garfield Community Learning Center, and Emmanuel Christian Academy.
Ownership History
Date
Name
Owned For
Owner Type
Purchase Details
Closed on
Mar 7, 2019
Sold by
Landmark Renovation Llc
Bought by
Porras George R
Current Estimated Value
Purchase Details
Closed on
Dec 20, 2013
Sold by
Harbour Protfolio Vi Lp
Bought by
Landmark Renovations Llc
Purchase Details
Closed on
Feb 7, 2013
Sold by
Harbour Portfolio Vi Lp
Bought by
Benson Anthony
Purchase Details
Closed on
Jul 21, 2011
Sold by
Harbour Portfolio Vi Lp
Bought by
Milkovich Mike
Purchase Details
Closed on
May 10, 2011
Sold by
Fannie Mae
Bought by
Harbour Portfolio Vi Lp
Purchase Details
Closed on
Sep 15, 2010
Sold by
Wood Patricia
Bought by
Fanniemae and Federal National Mortgage Association
Create a Home Valuation Report for This Property
The Home Valuation Report is an in-depth analysis detailing your home's value as well as a comparison with similar homes in the area
Home Values in the Area
Average Home Value in this Area
Purchase History
| Date | Buyer | Sale Price | Title Company |
|---|---|---|---|
| Porras George R | $30,000 | Buckeye Reserve Title Agency | |
| Landmark Renovations Llc | $16,000 | None Available | |
| Benson Anthony | $30,000 | None Available | |
| Milkovich Mike | $34,725 | None Available | |
| Harbour Portfolio Vi Lp | $7,596 | Tritan Title Services | |
| Fanniemae | $44,000 | Attorney |
Source: Public Records
Mortgage History
| Date | Status | Borrower | Loan Amount |
|---|---|---|---|
| Closed | Benson Anthony | $0 |
Source: Public Records
Tax History Compared to Growth
Tax History
| Year | Tax Paid | Tax Assessment Tax Assessment Total Assessment is a certain percentage of the fair market value that is determined by local assessors to be the total taxable value of land and additions on the property. | Land | Improvement |
|---|---|---|---|---|
| 2025 | $784 | $22,271 | $6,867 | $15,404 |
| 2024 | $784 | $22,271 | $6,867 | $15,404 |
| 2023 | $784 | $22,271 | $6,867 | $15,404 |
| 2022 | $571 | $15,775 | $4,736 | $11,039 |
| 2021 | $1,142 | $15,775 | $4,736 | $11,039 |
| 2020 | $1,125 | $15,780 | $4,740 | $11,040 |
| 2019 | $1,367 | $17,280 | $5,720 | $11,560 |
| 2018 | $1,528 | $17,280 | $5,720 | $11,560 |
| 2017 | $1,327 | $14,600 | $4,060 | $10,540 |
| 2016 | $1,327 | $15,660 | $4,060 | $11,600 |
| 2015 | $1,327 | $15,660 | $4,060 | $11,600 |
| 2014 | $1,317 | $15,660 | $4,060 | $11,600 |
| 2013 | $1,178 | $15,770 | $4,060 | $11,710 |
Source: Public Records
Map
Nearby Homes
- 828 Marie Ave
- 710 Clearview Ave
- 788 Saxon Ave
- 0 East Ave
- 905 National Ave
- 1574 East Ave
- 741 Jason Ave
- 754 Russell Ave
- 1637 East Ave Unit 1639
- 940 Lakewood Blvd
- 853 Russell Ave
- 738 Longview Ave
- 545 Thelma Ave
- 543 Thelma Ave
- 1855 17th St SW
- 539 Thelma Ave
- 1174 La Croix Ave
- 546 Thelma Ave
- 815 Sheridan St
- 534 Thelma Ave
- 760 Marie Ave
- 750 Marie Ave
- 770 Marie Ave
- 744 Marie Ave
- 811 Clearview Ave
- 761 Marie Ave
- 757 Marie Ave
- 765 Marie Ave
- 807 Clearview Ave
- 753 Marie Ave
- 769 Marie Ave
- 749 Marie Ave
- 780 Marie Ave
- 821 Clearview Ave
- 773 Marie Ave
- 795 Clearview Ave
- 745 Marie Ave
- 825 Clearview Ave
- 777 Marie Ave
- 1540 Hillcrest St