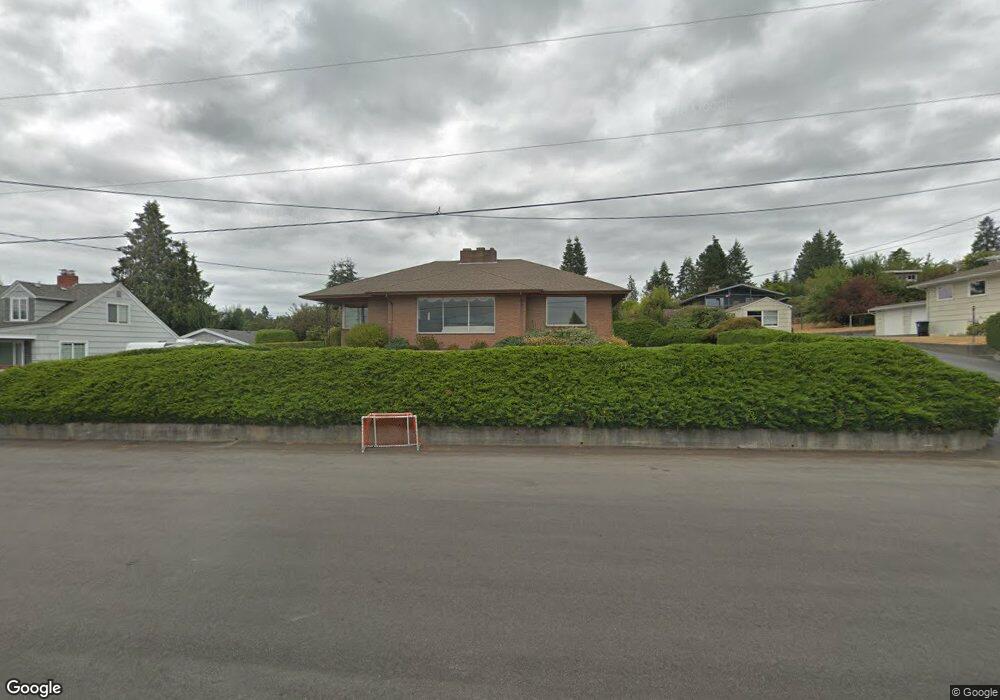
760 NE Matson St Poulsbo, WA 98370
Estimated Value: $673,803 - $871,000
3
Beds
2
Baths
1,383
Sq Ft
$534/Sq Ft
Est. Value
About This Home
This home is located at 760 NE Matson St, Poulsbo, WA 98370 and is currently estimated at $737,951, approximately $533 per square foot. 760 NE Matson St is a home located in Kitsap County with nearby schools including Poulsbo Elementary School, Poulsbo Middle School, and North Kitsap High School.
Ownership History
Date
Name
Owned For
Owner Type
Purchase Details
Closed on
Aug 19, 2013
Sold by
Peterson Cecil
Bought by
Peterson Cecil
Current Estimated Value
Create a Home Valuation Report for This Property
The Home Valuation Report is an in-depth analysis detailing your home's value as well as a comparison with similar homes in the area
Home Values in the Area
Average Home Value in this Area
Purchase History
| Date | Buyer | Sale Price | Title Company |
|---|---|---|---|
| Peterson Cecil | -- | None Available |
Source: Public Records
Tax History Compared to Growth
Tax History
| Year | Tax Paid | Tax Assessment Tax Assessment Total Assessment is a certain percentage of the fair market value that is determined by local assessors to be the total taxable value of land and additions on the property. | Land | Improvement |
|---|---|---|---|---|
| 2026 | $5,549 | $618,330 | $248,440 | $369,890 |
| 2025 | $5,549 | $618,330 | $248,440 | $369,890 |
| 2024 | $5,415 | $621,350 | $207,210 | $414,140 |
| 2023 | $5,507 | $621,350 | $207,210 | $414,140 |
| 2022 | $4,919 | $527,740 | $179,870 | $347,870 |
| 2021 | $4,768 | $474,060 | $161,170 | $312,890 |
| 2020 | $4,647 | $453,970 | $153,970 | $300,000 |
| 2019 | $4,356 | $425,490 | $143,900 | $281,590 |
| 2018 | $3,473 | $285,010 | $100,180 | $184,830 |
| 2017 | $3,276 | $285,010 | $100,180 | $184,830 |
| 2016 | $3,397 | $272,280 | $100,180 | $172,100 |
| 2015 | $3,308 | $266,500 | $100,180 | $166,320 |
| 2014 | -- | $258,410 | $100,180 | $158,230 |
| 2013 | -- | $258,410 | $100,180 | $158,230 |
Source: Public Records
Map
Nearby Homes
- 18330 9th Ave NE
- 18664 11th Ave NE
- 18637 Fjord Dr NE
- 493 NE Lincoln Rd
- 17667 State Highway 305 NE
- 0 XX Lemolo Shore Dr NE
- 1610 NE Mount Kamela Ct
- 18552 15th Loop NE
- 0 7th Ave NE Unit NWM2280996
- 600 NE Lincoln Rd Unit 41
- 18130 Sunrise Ridge Ave NE
- 18323 Sunrise Ridge Ave NE
- 17602 NE Midnight Sun Loop
- 17915 Sunrise Ridge Ave NE
- 17787 Sunrise Ridge Ave NE
- 123 NE Whimbrel Ln
- 20249 State Highway 305 NE
- 19463 Scoter Ln NE
- 32 NE Sunset St
- Asher Plan at Liberty Bay Vista
- 790 NE Matson St
- 734 NE Matson St
- 751 NE Sommerseth St
- 785 NE Sommerseth St
- 806 NE Matson St
- 773 NE Matson St
- 810 NE Matson St
- 753 NE Matson St
- 801 NE Matson St
- 802 NE Matson St
- 702 NE Matson St
- 791 NE Matson St
- 721 NE Matson St
- 19 8th Ave NE
- 682 NE Matson St
- 703 NE Matson St
- 18341 9th Ave NE
- 18261 9th Ave NE
- 18285 9th Ave NE
- 18239 9th Ave NE