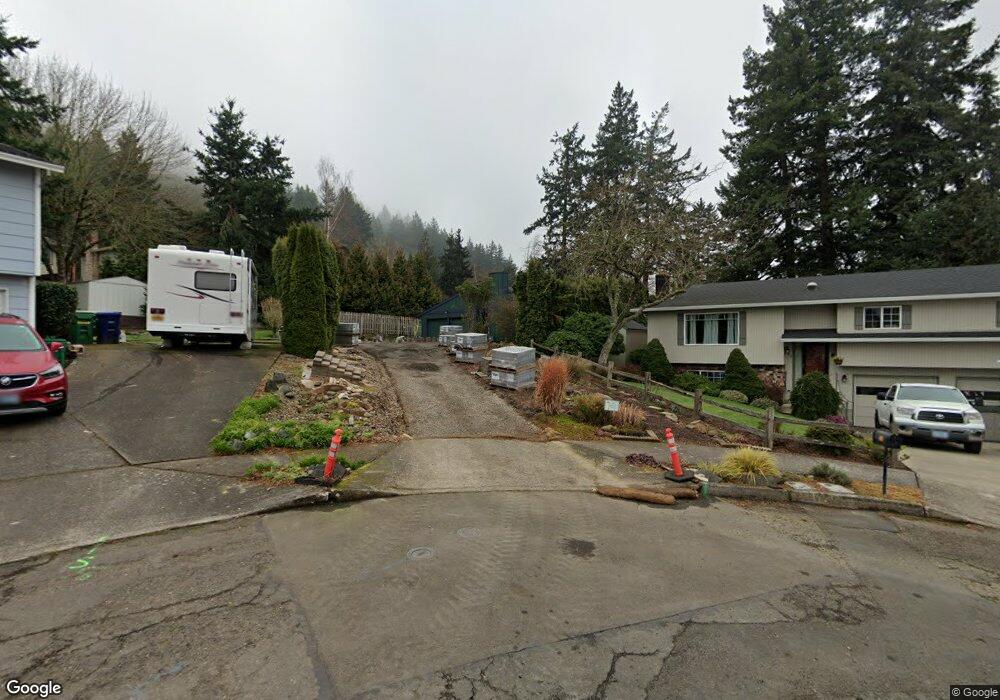
760 SW 5th Ct Gresham, OR 97080
Gresham Butte NeighborhoodEstimated Value: $434,000 - $492,000
3
Beds
2
Baths
1,463
Sq Ft
$311/Sq Ft
Est. Value
About This Home
This home is located at 760 SW 5th Ct, Gresham, OR 97080 and is currently estimated at $455,642, approximately $311 per square foot. 760 SW 5th Ct is a home located in Multnomah County with nearby schools including Dexter McCarty Middle School, Gresham High School, and Gresham Arthur Academy.
Ownership History
Date
Name
Owned For
Owner Type
Purchase Details
Closed on
Jul 26, 2016
Sold by
Thomas Investments Llc
Bought by
Rochells Mary Elinor
Current Estimated Value
Home Financials for this Owner
Home Financials are based on the most recent Mortgage that was taken out on this home.
Original Mortgage
$159,900
Outstanding Balance
$71,466
Interest Rate
3.54%
Mortgage Type
New Conventional
Estimated Equity
$384,176
Purchase Details
Closed on
Jul 18, 2016
Sold by
Rand Investments Llc
Bought by
Thomas Investments Llc
Home Financials for this Owner
Home Financials are based on the most recent Mortgage that was taken out on this home.
Original Mortgage
$159,900
Outstanding Balance
$71,466
Interest Rate
3.54%
Mortgage Type
New Conventional
Estimated Equity
$384,176
Purchase Details
Closed on
Jun 14, 2001
Sold by
Miyazono Earle T
Bought by
Rand Investments Llc
Purchase Details
Closed on
Dec 4, 2000
Sold by
Rand Investments Llc
Bought by
Miyazono Earle T and Miyazono Fumie A
Purchase Details
Closed on
Oct 12, 2000
Sold by
Aames Capital Corp
Bought by
Rand Investments Llc
Purchase Details
Closed on
Aug 14, 2000
Sold by
Seiler Scott K
Bought by
Aames Capital Corp
Create a Home Valuation Report for This Property
The Home Valuation Report is an in-depth analysis detailing your home's value as well as a comparison with similar homes in the area
Home Values in the Area
Average Home Value in this Area
Purchase History
| Date | Buyer | Sale Price | Title Company |
|---|---|---|---|
| Rochells Mary Elinor | $289,900 | First American | |
| Thomas Investments Llc | -- | Accommodation | |
| Rand Investments Llc | -- | Pacific Nw Title | |
| Miyazono Earle T | -- | Pacific Nw Title | |
| Rand Investments Llc | $104,700 | First American Title Co | |
| Aames Capital Corp | $132,914 | First American Title Co |
Source: Public Records
Mortgage History
| Date | Status | Borrower | Loan Amount |
|---|---|---|---|
| Open | Rochells Mary Elinor | $159,900 |
Source: Public Records
Tax History
| Year | Tax Paid | Tax Assessment Tax Assessment Total Assessment is a certain percentage of the fair market value that is determined by local assessors to be the total taxable value of land and additions on the property. | Land | Improvement |
|---|---|---|---|---|
| 2025 | $5,154 | $253,270 | -- | -- |
| 2024 | $4,934 | $245,900 | -- | -- |
| 2023 | $4,495 | $238,740 | $0 | $0 |
| 2022 | $4,369 | $231,790 | $0 | $0 |
| 2021 | $4,259 | $225,040 | $0 | $0 |
| 2020 | $4,008 | $218,490 | $0 | $0 |
| 2019 | $3,903 | $212,130 | $0 | $0 |
| 2018 | $3,721 | $205,960 | $0 | $0 |
| 2017 | $3,570 | $199,970 | $0 | $0 |
| 2016 | $3,148 | $194,150 | $0 | $0 |
Source: Public Records
Map
Nearby Homes
- 419 SW Day Ct
- 638 SW 7th St
- 159 SW Florence Ave Unit 64
- 159 SW Florence Ave
- 1434 SW 5th Place
- 645 W Powell Blvd
- 1113 W Powell Blvd
- 625 SW Miller Ct
- 1407 SW Walters Dr
- 1175 SW Chastain Dr
- 55 SW Lovhar Dr
- 0 SW Miller Ct Unit 470855683
- 415 SE Roberts Ave
- 417 SE Roberts Ave
- 44 SW Birdsdale Dr
- 0 NE 5th St
- 318 NE Roberts Ave Unit 308
- 318 NE Roberts Ave Unit 203
- 1960 SW 13th Ct
- 1333 SW 19th Dr
- 790 SW 5th Ct
- 655 SW Sleret Ave
- 730 SW 5th Ct
- 673 SW Sleret Ave
- 637 SW Sleret Ave
- 797 SW 5th Ct
- 428 SW Day Ct
- 746 SW 4th St
- 740 SW 4th St
- 416 SW Day Ct
- 690 SW 5th Ct
- 619 SW Sleret Ave
- 775 SW 5th Ct
- 691 SW Sleret Ave
- 738 SW 4th St
- 745 SW 5th Ct
- 430 SW Day Ct
- 402 SW Day Ct
- 720 SW 4th St
- 642 SW Sleret Ave
Your Personal Tour Guide
Ask me questions while you tour the home.