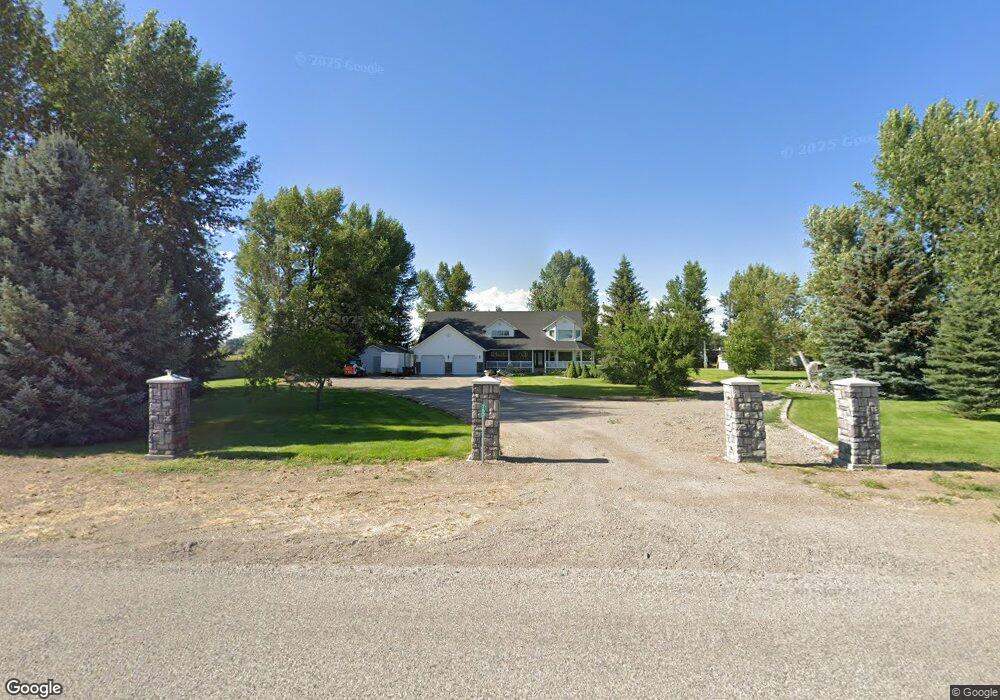
760 W 100 S Blackfoot, ID 83221
Estimated Value: $610,000 - $723,000
4
Beds
3
Baths
4,056
Sq Ft
$158/Sq Ft
Est. Value
About This Home
This home is located at 760 W 100 S, Blackfoot, ID 83221 and is currently estimated at $639,191, approximately $157 per square foot. 760 W 100 S is a home located in Bingham County with nearby schools including Riverside Elementary School, Moreland Elementary School, and Rockford Elementary School.
Ownership History
Date
Name
Owned For
Owner Type
Purchase Details
Closed on
Dec 20, 2022
Sold by
Ht Ventures Llc
Bought by
Wheeler Kevin P
Current Estimated Value
Purchase Details
Closed on
Nov 26, 2019
Sold by
Wheeler Kevin
Bought by
Wheeler Kevin P
Home Financials for this Owner
Home Financials are based on the most recent Mortgage that was taken out on this home.
Original Mortgage
$235,150
Interest Rate
3.6%
Mortgage Type
New Conventional
Purchase Details
Closed on
Apr 29, 2010
Sold by
Wheeler Kevin
Bought by
Wheeler Kevin and Wheeler Heather C
Create a Home Valuation Report for This Property
The Home Valuation Report is an in-depth analysis detailing your home's value as well as a comparison with similar homes in the area
Home Values in the Area
Average Home Value in this Area
Purchase History
| Date | Buyer | Sale Price | Title Company |
|---|---|---|---|
| Wheeler Kevin P | -- | Flying S Title And Escrow Of I | |
| Wheeler Kevin P | -- | Alliance Title Blackfoot Off | |
| Wheeler Kevin | -- | -- |
Source: Public Records
Mortgage History
| Date | Status | Borrower | Loan Amount |
|---|---|---|---|
| Previous Owner | Wheeler Kevin P | $235,150 |
Source: Public Records
Tax History Compared to Growth
Tax History
| Year | Tax Paid | Tax Assessment Tax Assessment Total Assessment is a certain percentage of the fair market value that is determined by local assessors to be the total taxable value of land and additions on the property. | Land | Improvement |
|---|---|---|---|---|
| 2025 | $1,122 | $536,262 | $95,360 | $440,902 |
| 2024 | $1,122 | $511,118 | $70,216 | $440,902 |
| 2023 | $2,349 | $499,323 | $70,216 | $429,107 |
| 2022 | $4,298 | $430,955 | $70,216 | $360,739 |
| 2021 | $2,967 | $376,020 | $62,216 | $313,804 |
| 2020 | $2,474 | $289,667 | $0 | $0 |
| 2019 | $2,715 | $289,667 | $0 | $0 |
| 2018 | $2,100 | $235,165 | $39,608 | $195,557 |
| 2017 | $2,022 | $226,897 | $31,340 | $195,557 |
| 2016 | $2,093 | $226,897 | $0 | $0 |
| 2015 | $2,035 | $226,897 | $0 | $0 |
| 2014 | $2,035 | $226,897 | $31,340 | $195,557 |
Source: Public Records
Map
Nearby Homes