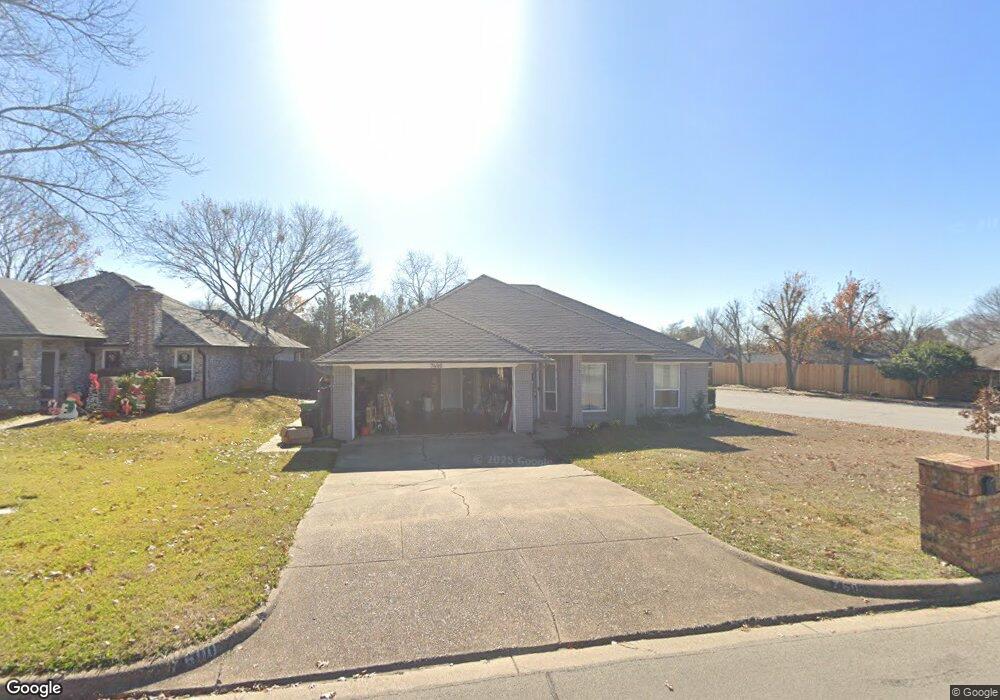
7600 Kimberly Ct North Richland Hills, TX 76182
Estimated Value: $334,000 - $358,000
3
Beds
2
Baths
1,657
Sq Ft
$211/Sq Ft
Est. Value
About This Home
This home is located at 7600 Kimberly Ct, North Richland Hills, TX 76182 and is currently estimated at $349,329, approximately $210 per square foot. 7600 Kimberly Ct is a home located in Tarrant County with nearby schools including Smithfield Elementary School, Smithfield Middle School, and Birdville High School.
Ownership History
Date
Name
Owned For
Owner Type
Purchase Details
Closed on
Sep 21, 2004
Sold by
Elmore Jamie and Elmore Kelly Crone
Bought by
Ingram Brian M and Ingram Tiffany D
Current Estimated Value
Home Financials for this Owner
Home Financials are based on the most recent Mortgage that was taken out on this home.
Original Mortgage
$108,202
Outstanding Balance
$49,503
Interest Rate
5.86%
Mortgage Type
FHA
Estimated Equity
$299,826
Purchase Details
Closed on
May 30, 2000
Sold by
Isaacson Sue and Isaacson Michael
Bought by
Elmore Jamie and Elmore Kelly Crone
Home Financials for this Owner
Home Financials are based on the most recent Mortgage that was taken out on this home.
Original Mortgage
$98,949
Interest Rate
8.13%
Purchase Details
Closed on
Jul 16, 1998
Sold by
Isaacson Paul Lee
Bought by
Isaacson Sue
Home Financials for this Owner
Home Financials are based on the most recent Mortgage that was taken out on this home.
Original Mortgage
$85,790
Interest Rate
6.94%
Create a Home Valuation Report for This Property
The Home Valuation Report is an in-depth analysis detailing your home's value as well as a comparison with similar homes in the area
Home Values in the Area
Average Home Value in this Area
Purchase History
| Date | Buyer | Sale Price | Title Company |
|---|---|---|---|
| Ingram Brian M | -- | -- | |
| Elmore Jamie | -- | First American Title Co | |
| Isaacson Sue | -- | -- |
Source: Public Records
Mortgage History
| Date | Status | Borrower | Loan Amount |
|---|---|---|---|
| Open | Ingram Brian M | $108,202 | |
| Previous Owner | Elmore Jamie | $98,949 | |
| Previous Owner | Isaacson Sue | $85,790 |
Source: Public Records
Tax History Compared to Growth
Tax History
| Year | Tax Paid | Tax Assessment Tax Assessment Total Assessment is a certain percentage of the fair market value that is determined by local assessors to be the total taxable value of land and additions on the property. | Land | Improvement |
|---|---|---|---|---|
| 2025 | $4,987 | $353,681 | $60,000 | $293,681 |
| 2024 | $4,987 | $353,681 | $60,000 | $293,681 |
| 2023 | $6,179 | $323,608 | $60,000 | $263,608 |
| 2022 | $6,162 | $300,065 | $40,000 | $260,065 |
| 2021 | $5,923 | $260,949 | $40,000 | $220,949 |
| 2020 | $5,385 | $236,432 | $40,000 | $196,432 |
| 2019 | $5,066 | $228,576 | $40,000 | $188,576 |
| 2018 | $4,089 | $174,893 | $40,000 | $134,893 |
| 2017 | $4,278 | $179,413 | $40,000 | $139,413 |
| 2016 | $3,889 | $166,569 | $12,000 | $154,569 |
| 2015 | $3,194 | $131,400 | $12,000 | $119,400 |
| 2014 | $3,194 | $131,400 | $12,000 | $119,400 |
Source: Public Records
Map
Nearby Homes
- 7513 Chapman Rd
- 7501 April Ln
- 7525 Chapman Rd
- 6737 Bartay Dr
- 7717 Reis Ln
- 7696 Resting Mews Ln
- 6744 Hewitt St
- 6321 Little Ranch Rd
- 6200 Kings Path
- 6201 Queens Path
- 7500 Regal Ln
- 6800 Hewitt St
- 6825 Meadow Rd
- 7233 Romford Way
- 6812 S Fork Dr
- 0 Mid Cities Blvd
- 6909 Meadow Creek Rd
- 6725 S Fork Dr
- 7457 N College Cir
- 7133 Winchester Rd