Estimated payment $14,080/month
About This Lot
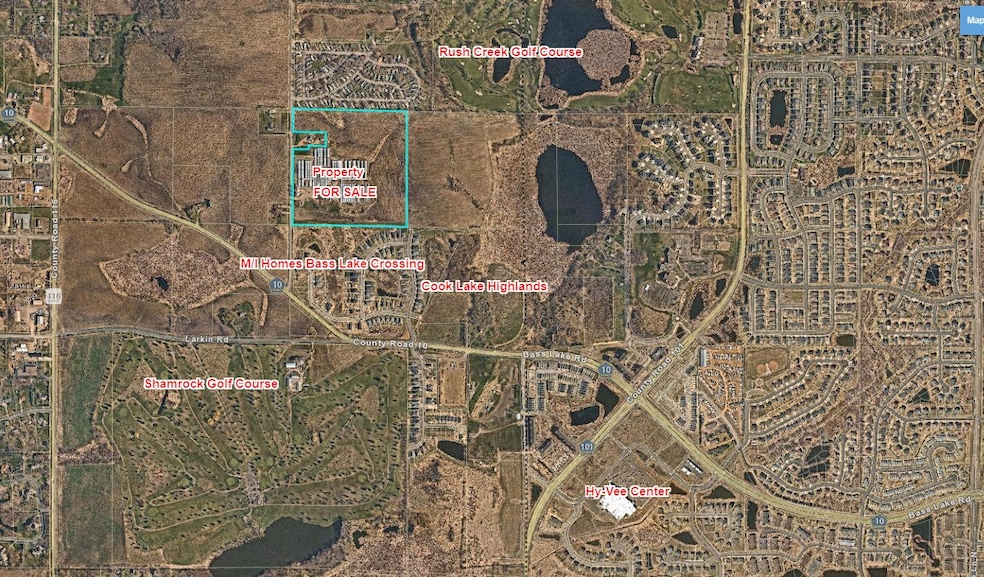
This property is guided low density residential allowing for up to 3-5 units per acre. It is located within walking distance to neighborhood retail services at the HYVEE Shopping Center, Rush Creek Golf Course, and Shamrock Golf Course. This property is being offered "AS IS"
Property Details
Property Type
- Land
Est. Annual Taxes
- $8,231
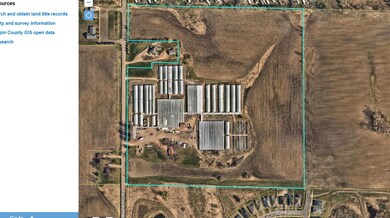
Lot Details
- Lot Dimensions are 1330 x 1330
Community Details
- No Home Owners Association
- Chastek Farm Subdivision
Listing and Financial Details
- Assessor Parcel Number 2511923120002
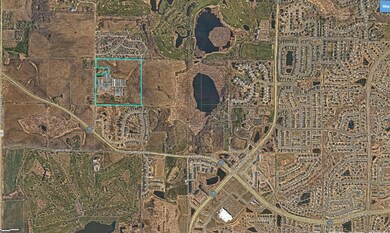
Map
Home Values in the Area
Average Home Value in this Area
Tax History
| Year | Tax Paid | Tax Assessment Tax Assessment Total Assessment is a certain percentage of the fair market value that is determined by local assessors to be the total taxable value of land and additions on the property. | Land | Improvement |
|---|---|---|---|---|
| 2024 | $27,987 | $2,283,200 | $1,502,100 | $781,100 |
| 2023 | $8,231 | $1,196,500 | $412,800 | $783,700 |
| 2022 | $6,550 | $396,000 | $113,000 | $283,000 |
| 2021 | $6,437 | $295,000 | $75,000 | $220,000 |
| 2020 | $6,892 | $825,200 | $304,500 | $520,700 |
| 2019 | $7,280 | $284,300 | $69,000 | $215,300 |
| 2018 | $6,199 | $295,000 | $69,000 | $226,000 |
| 2017 | $6,967 | $779,800 | $282,800 | $497,000 |
| 2016 | $7,028 | $794,500 | $314,500 | $480,000 |
| 2015 | $7,024 | $789,200 | $309,200 | $480,000 |
| 2014 | -- | $724,200 | $264,200 | $460,000 |
Property History
| Date | Event | Price | List to Sale | Price per Sq Ft |
|---|---|---|---|---|
| 11/09/2022 11/09/22 | Pending | -- | -- | -- |
| 07/16/2022 07/16/22 | For Sale | $2,600,000 | -- | -- |
Purchase History
| Date | Type | Sale Price | Title Company |
|---|---|---|---|
| Interfamily Deed Transfer | -- | None Available | |
| Interfamily Deed Transfer | -- | None Available |
Source: NorthstarMLS
MLS Number: 6236617
APN: 25-119-23-12-0002
Disclaimer: Certain information contained herein is derived from information provided by parties other than Homes.com. All information provided is deemed reliable, but is not guaranteed to be accurate and should be independently verified.
![]() Based on information submitted to the MLS GRID. All data is obtained from various sources and may not have been verified by broker or MLS GRID. Supplied Open House Information is subject to change without notice. All information should be independently reviewed and verified for accuracy. Properties may or may not be listed by the office/agent presenting the information. Some IDX listings have been excluded from this website.
Based on information submitted to the MLS GRID. All data is obtained from various sources and may not have been verified by broker or MLS GRID. Supplied Open House Information is subject to change without notice. All information should be independently reviewed and verified for accuracy. Properties may or may not be listed by the office/agent presenting the information. Some IDX listings have been excluded from this website.
Based on information submitted to the MLS GRID
- 7501 Fir Ln N
- 7800 Maple Hill Rd Unit F13
- 7800 Maple Hill Rd Unit b11
- 7428 Elm Ln
- 19214 72nd Ave N
- 7265 Zircon Ct N
- 20015 79th Ave
- 7161 Walnut Grove Way N
- 20057 79th Ave
- 7167 Walnut Grove Way N
- 20125 78th Place
- 19964 79th Ave
- 20093 79th Ave
- 7150 Walnut Grove Ln N
- 20006 79th Ave
- 20000 79th Ave
- 19994 79th Ave
- 19973 79th Ave
- 19955 79th Ave
- 8300 County Road 116

Ask me questions while you tour the home.