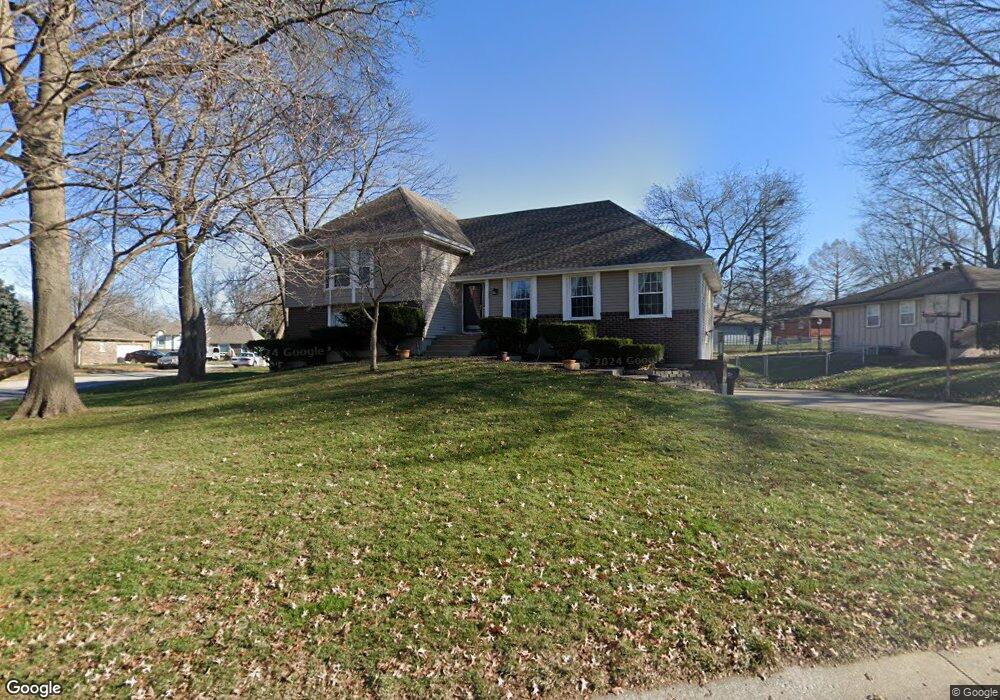
7601 Crisp Ave Raytown, MO 64138
Estimated Value: $271,827 - $325,000
3
Beds
3
Baths
1,896
Sq Ft
$153/Sq Ft
Est. Value
About This Home
This home is located at 7601 Crisp Ave, Raytown, MO 64138 and is currently estimated at $289,707, approximately $152 per square foot. 7601 Crisp Ave is a home located in Jackson County with nearby schools including Robinson Elementary School and Raytown Central Middle School.
Ownership History
Date
Name
Owned For
Owner Type
Purchase Details
Closed on
Mar 4, 2016
Sold by
Austin Wesley Realty Llc
Bought by
Austin Obie
Current Estimated Value
Purchase Details
Closed on
Mar 28, 2001
Sold by
Patterson Floyd A and Patterson Camille A
Bought by
Austin Obie A and Austin Tiffaney M
Home Financials for this Owner
Home Financials are based on the most recent Mortgage that was taken out on this home.
Original Mortgage
$128,250
Interest Rate
6.98%
Mortgage Type
Purchase Money Mortgage
Purchase Details
Closed on
Feb 23, 2000
Sold by
Larson Gerald E
Bought by
Patterson Floyd A and Patterson Camille A
Home Financials for this Owner
Home Financials are based on the most recent Mortgage that was taken out on this home.
Original Mortgage
$128,647
Interest Rate
8.19%
Mortgage Type
VA
Create a Home Valuation Report for This Property
The Home Valuation Report is an in-depth analysis detailing your home's value as well as a comparison with similar homes in the area
Home Values in the Area
Average Home Value in this Area
Purchase History
We collect this data history from publicly available records. To have your information removed, we recommend requesting removal directly through your county’s website.
| Date | Buyer | Sale Price | Title Company |
|---|---|---|---|
| Austin Obie | -- | First American Title | |
| Austin Obie A | -- | Ati Title Company | |
| Patterson Floyd A | -- | Ati Title Company |
Source: Public Records
Mortgage History
We collect this data history from publicly available records. To have your information removed, we recommend requesting removal directly through your county’s website.
| Date | Status | Borrower | Loan Amount |
|---|---|---|---|
| Previous Owner | Austin Obie A | $128,250 | |
| Previous Owner | Patterson Floyd A | $128,647 |
Source: Public Records
Tax History
| Year | Tax Paid | Tax Assessment Tax Assessment Total Assessment is a certain percentage of the fair market value that is determined by local assessors to be the total taxable value of land and additions on the property. | Land | Improvement |
|---|---|---|---|---|
| 2025 | $4,173 | $39,449 | $5,312 | $34,137 |
| 2024 | $4,145 | $46,261 | $4,530 | $41,731 |
| 2023 | $4,145 | $46,261 | $6,663 | $39,598 |
| 2022 | $2,806 | $29,830 | $4,223 | $25,607 |
| 2021 | $2,816 | $29,830 | $4,223 | $25,607 |
| 2020 | $2,706 | $28,392 | $4,223 | $24,169 |
| 2019 | $2,691 | $28,392 | $4,223 | $24,169 |
| 2018 | $2,262 | $24,710 | $3,675 | $21,035 |
| 2017 | $2,230 | $24,710 | $3,675 | $21,035 |
| 2016 | $2,230 | $24,502 | $3,914 | $20,588 |
| 2014 | $2,189 | $23,788 | $3,800 | $19,988 |
Source: Public Records
Map
Nearby Homes
- 11422 E 75th St
- 7402 Englewood Ln
- 11708 E 75th St
- 11709 E 77th Terrace
- 7423 Harris Ave
- 11004 E 78th St
- 12001 E 77th Terrace
- 7413 Hedges Ave
- 7824 Westridge Rd
- 7719 Larson Ave
- 7650 Larson Ave
- 11709 E 71st Ct
- 7109 Harvard Ave
- 7923 Harris Ave
- 12301 E 78th St
- 12304 E 78th St
- 7206 Larson Ave
- 8001 Westridge Rd Unit 102
- 10605 E 79th St
- 7401 Hardy Ave
- 7516 Englewood Ave
- 7512 Englewood Ave
- 7517 Crisp Ave
- 7600 Englewood Ave
- 7513 Crisp Ave
- 7517 Englewood Ave
- 7508 Englewood Ave
- 7521 Englewood Ave
- 7513 Englewood Ave
- 7509 Crisp Ave
- 7509 Englewood Ave
- 7601 Englewood Ave
- 7604 Englewood Ave
- 7504 Englewood Ave
- 7516 Crisp Ave
- 7605 Crisp Ave
- 7512 Crisp Ave
- 7505 Crisp Ave
- 7500 Englewood Ave
- 7520 Crisp Ave
Your Personal Tour Guide
Ask me questions while you tour the home.