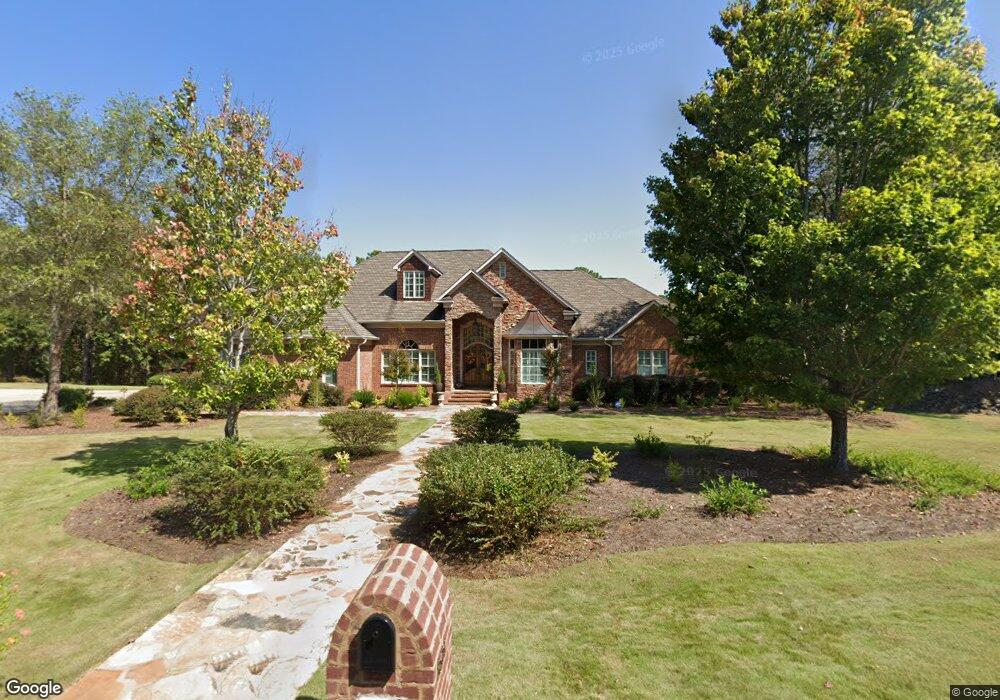
7601 Rolling Bend Rd Columbus, GA 31904
North Columbus NeighborhoodEstimated Value: $649,000 - $770,000
4
Beds
4
Baths
3,730
Sq Ft
$185/Sq Ft
Est. Value
About This Home
This home is located at 7601 Rolling Bend Rd, Columbus, GA 31904 and is currently estimated at $688,189, approximately $184 per square foot. 7601 Rolling Bend Rd is a home located in Muscogee County with nearby schools including River Road Elementary School, Double Churches Middle School, and Northside High School.
Ownership History
Date
Name
Owned For
Owner Type
Purchase Details
Closed on
Oct 11, 2021
Sold by
Butler Theotus
Bought by
Hannon Patricia D
Current Estimated Value
Purchase Details
Closed on
Feb 13, 2019
Sold by
Hannon Patricia D
Bought by
Hannon Patricia D and Butler Theotus
Home Financials for this Owner
Home Financials are based on the most recent Mortgage that was taken out on this home.
Original Mortgage
$429,600
Interest Rate
4.5%
Mortgage Type
New Conventional
Purchase Details
Closed on
Feb 4, 2019
Sold by
Cantrell Richard M
Bought by
Hannon Patricia D
Home Financials for this Owner
Home Financials are based on the most recent Mortgage that was taken out on this home.
Original Mortgage
$429,600
Interest Rate
4.5%
Mortgage Type
New Conventional
Create a Home Valuation Report for This Property
The Home Valuation Report is an in-depth analysis detailing your home's value as well as a comparison with similar homes in the area
Home Values in the Area
Average Home Value in this Area
Purchase History
| Date | Buyer | Sale Price | Title Company |
|---|---|---|---|
| Hannon Patricia D | -- | Sikes S Scot | |
| Hannon Patricia D | -- | -- | |
| Hannon Patricia D | $537,000 | -- |
Source: Public Records
Mortgage History
| Date | Status | Borrower | Loan Amount |
|---|---|---|---|
| Previous Owner | Hannon Patricia D | $429,600 |
Source: Public Records
Tax History
| Year | Tax Paid | Tax Assessment Tax Assessment Total Assessment is a certain percentage of the fair market value that is determined by local assessors to be the total taxable value of land and additions on the property. | Land | Improvement |
|---|---|---|---|---|
| 2025 | $6,399 | $259,580 | $43,560 | $216,020 |
| 2024 | $6,398 | $259,580 | $43,560 | $216,020 |
| 2023 | $5,859 | $259,580 | $43,560 | $216,020 |
| 2022 | $6,723 | $206,072 | $43,560 | $162,512 |
| 2021 | $6,972 | $200,060 | $43,560 | $156,500 |
| 2020 | $6,974 | $200,060 | $43,560 | $156,500 |
| 2019 | $5,859 | $183,524 | $55,057 | $128,467 |
| 2018 | $5,859 | $183,524 | $55,057 | $128,467 |
| 2017 | $5,883 | $183,524 | $55,057 | $128,467 |
| 2016 | $5,909 | $180,776 | $14,403 | $166,373 |
| 2015 | $5,918 | $180,776 | $14,403 | $166,373 |
| 2014 | $5,927 | $180,776 | $14,403 | $166,373 |
| 2013 | -- | $180,776 | $14,403 | $166,373 |
Source: Public Records
Map
Nearby Homes
- 7301 Grand View Rd
- Lot 100 Rolling Bend Rd
- 7633 Grand Ridge Rd
- 1544 Glencoe Dr
- 7349 Lullwater Rd
- 7172 Standing Boy Rd
- 7281 Stillwater Dr
- 1065 Lee Road 315
- 1043 Lee Road 315
- 1001 Lee Road 315
- 479 Lee Road 315
- 7209 Williams Hill Rd
- 7186 Williams Hill Rd
- 1405 Big Eddy Ct
- 4 Mountain Ridge Ct
- 5 Mountain Ridge Ct
- 7620 River Rd
- Lot 52 Creekrise Dr
- Lot 53 Creekrise Dr
- 6758 Standing Boy Rd
- 7310 Grand View Rd
- 7635 Rolling Bend Rd
- 101 Winterhaven Way
- 7600 Rolling Bend Rd
- 7600 Rolling Bend Rd Unit 4
- 7600 Rolling Bend Rd Unit 5
- 7600 Rolling Bend Rd Unit 3
- 7600 Rolling Bend Rd Unit 5
- 7600 Rolling Bend Rd Unit 4
- 7600 Rolling Bend Rd Unit 3
- 7600 Rolling Bend Rd Unit 1
- 7320 Grand View Rd
- 7311 Grand View Rd
- 7626 Grand Ridge Rd
- 201 Winterhaven Way
- 7200 Grand View Ct
- 7618 Grand Ridge Rd
- 7449 Rolling Bend Ct
- 7209 Grand View Ct
- 7645 Rolling Bend Rd
Your Personal Tour Guide
Ask me questions while you tour the home.