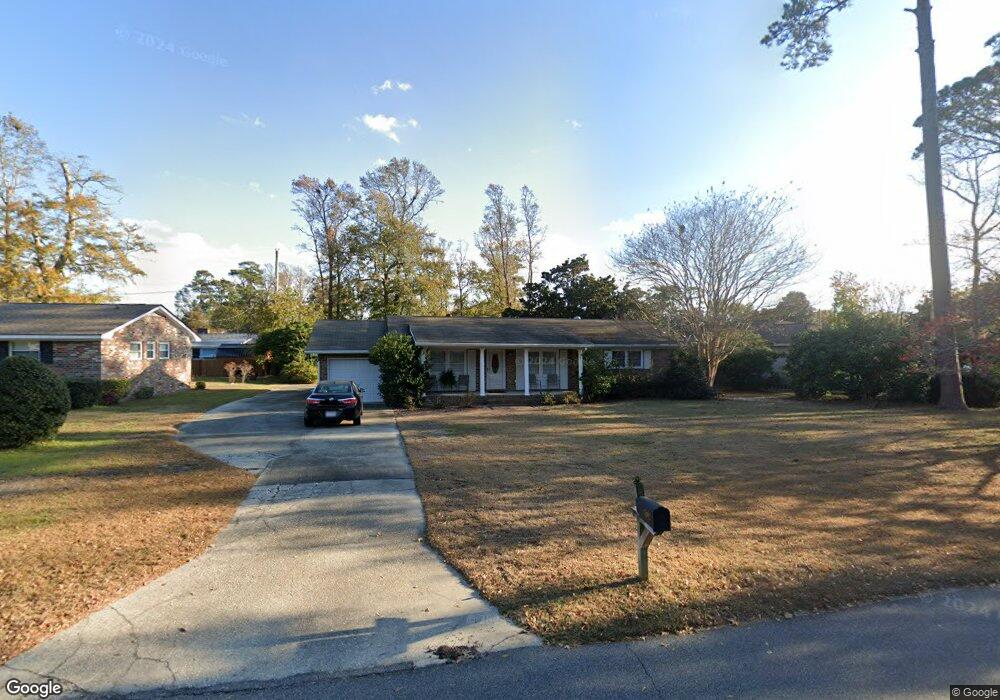
7602 Coteswood Dr Unit MB Myrtle Beach, SC 29572
Grande Dunes NeighborhoodEstimated Value: $416,000 - $470,000
3
Beds
2
Baths
1,428
Sq Ft
$305/Sq Ft
Est. Value
About This Home
This home is located at 7602 Coteswood Dr Unit MB, Myrtle Beach, SC 29572 and is currently estimated at $435,534, approximately $304 per square foot. 7602 Coteswood Dr Unit MB is a home located in Horry County with nearby schools including Myrtle Beach Child Development Center, Myrtle Beach Elementary School, and Myrtle Beach Primary School.
Ownership History
Date
Name
Owned For
Owner Type
Purchase Details
Closed on
May 9, 2024
Sold by
Brown Barbara G
Bought by
Brown Barbara G Tr and Brown Keith L
Current Estimated Value
Purchase Details
Closed on
Jul 22, 2009
Sold by
Brown Keith L
Bought by
Keith L Brown and Keith Barbara G Brown Revoc
Purchase Details
Closed on
Apr 27, 2007
Sold by
Williams David L and Williams Sheryl D
Bought by
Brown Keith and Brown Barbara
Purchase Details
Closed on
Feb 22, 2006
Sold by
Integra Investments Llc
Bought by
Williams David L and Williams Sheryl D
Purchase Details
Closed on
Mar 14, 2003
Sold by
Foreman Denise A
Bought by
Integra Investments Llc
Purchase Details
Closed on
Dec 10, 1998
Sold by
Bills Josephine E
Bought by
Foreman Denise A
Home Financials for this Owner
Home Financials are based on the most recent Mortgage that was taken out on this home.
Original Mortgage
$21,036
Interest Rate
6.94%
Mortgage Type
Purchase Money Mortgage
Create a Home Valuation Report for This Property
The Home Valuation Report is an in-depth analysis detailing your home's value as well as a comparison with similar homes in the area
Home Values in the Area
Average Home Value in this Area
Purchase History
| Date | Buyer | Sale Price | Title Company |
|---|---|---|---|
| Brown Barbara G Tr | -- | -- | |
| Keith L Brown | -- | -- | |
| Brown Keith | $295,000 | None Available | |
| Williams David L | $233,900 | None Available | |
| Integra Investments Llc | $87,000 | -- | |
| Foreman Denise A | $3,000 | -- |
Source: Public Records
Mortgage History
| Date | Status | Borrower | Loan Amount |
|---|---|---|---|
| Previous Owner | Foreman Denise A | $21,036 |
Source: Public Records
Tax History Compared to Growth
Tax History
| Year | Tax Paid | Tax Assessment Tax Assessment Total Assessment is a certain percentage of the fair market value that is determined by local assessors to be the total taxable value of land and additions on the property. | Land | Improvement |
|---|---|---|---|---|
| 2024 | $411 | $11,419 | $6,921 | $4,498 |
| 2023 | $411 | $5,752 | $2,886 | $2,866 |
| 2021 | $345 | $7,442 | $3,462 | $3,980 |
| 2020 | $298 | $7,442 | $3,462 | $3,980 |
| 2019 | $287 | $7,442 | $3,462 | $3,980 |
| 2018 | $236 | $5,001 | $2,509 | $2,492 |
| 2017 | $382 | $5,001 | $2,509 | $2,492 |
| 2016 | -- | $5,001 | $2,509 | $2,492 |
| 2015 | $227 | $5,002 | $2,510 | $2,492 |
| 2014 | $205 | $5,002 | $2,510 | $2,492 |
Source: Public Records
Map
Nearby Homes
- 7600 Glenwood Dr
- 7600 Driftwood Dr
- 7616 Glenwood Dr
- 7623 Coteswood Dr
- 756 Conifer Ct
- 650 Providence Dr
- 608 Providence Dr Unit 47
- 8 Martinique
- 8189 Buffy Ln
- 405 77th Ave N Unit 5
- 7268 Seville Dr
- 7253 Seville Dr
- 403 76th Ave N Unit 6
- 8091 Laurel Ash Ave Unit Lot 47
- 8079 Laurel Ash Ave Unit Lot 49
- 7700 Porcher Dr Unit 3305
- 7700 Porcher Dr Unit 3207
- 8057 Laurel Ash Ave
- 406 74th Ave N Unit B
- 8111 Laurel Ash Ave Unit Lot 43
- 7604 Coteswood Dr
- 7600 Coteswood Dr Unit MB
- 7603 Brentwood Dr
- 7605 Brentwood Dr
- 7601 Brentwood Dr
- 7606 Coteswood Dr
- 7603 Coteswood Dr
- 7613 Brentwood Dr
- 7605 Coteswood Dr
- 7607 Brentwood Dr
- 7607 Coteswood Dr
- 7608 Coteswood Dr
- 7575 Siena Blvd Unit Siena Park
- 7575 Siena Blvd Unit 50 Siena Park
- 7575 Siena Blvd
- 7609 Brentwood Dr
- 7602 Brentwood Dr
- 7600 Brentwood Dr
- 7604 Glenwood Dr
- 7604 Brentwood Dr