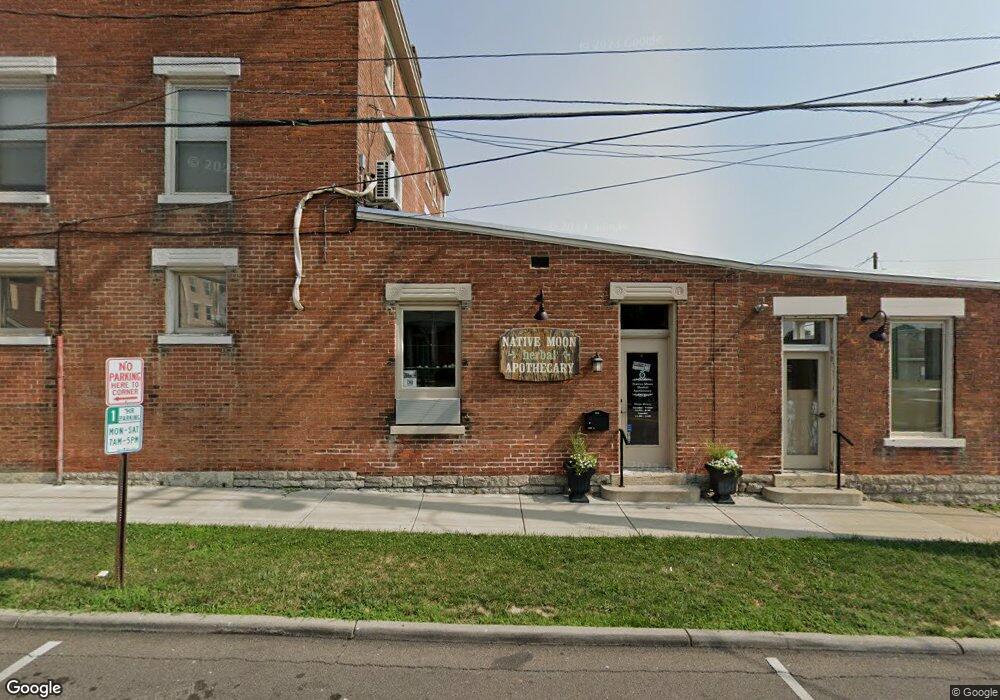
7602 Hamilton Ave Cincinnati, OH 45231
Estimated Value: $295,613
Studio
1
Bath
5,170
Sq Ft
$57/Sq Ft
Est. Value
About This Home
This home is located at 7602 Hamilton Ave, Cincinnati, OH 45231 and is currently estimated at $295,613, approximately $57 per square foot. 7602 Hamilton Ave is a home located in Hamilton County with nearby schools including Mt Healthy High School, Hamilton County Mathematics and Science Academy, and Central Baptist Academy.
Ownership History
Date
Name
Owned For
Owner Type
Purchase Details
Closed on
May 26, 2016
Sold by
U S Bank National Association Tr
Bought by
Frank Properties Llc
Current Estimated Value
Home Financials for this Owner
Home Financials are based on the most recent Mortgage that was taken out on this home.
Interest Rate
3.64%
Purchase Details
Closed on
Aug 14, 2015
Sold by
Adams Don E and Adams Don E
Bought by
U S Bank National Association
Purchase Details
Closed on
Mar 13, 2007
Sold by
Crowder Robert R
Bought by
Adams Don E
Home Financials for this Owner
Home Financials are based on the most recent Mortgage that was taken out on this home.
Original Mortgage
$120,000
Interest Rate
6.2%
Mortgage Type
Commercial
Purchase Details
Closed on
Mar 24, 1999
Sold by
Crowder Robert R
Bought by
Crowder Robert R and The Robert R Crowder Living Trust
Purchase Details
Closed on
Mar 9, 1994
Sold by
Lyons James W and Lyons Linda A
Bought by
Crowder Robert R
Create a Home Valuation Report for This Property
The Home Valuation Report is an in-depth analysis detailing your home's value as well as a comparison with similar homes in the area
Home Values in the Area
Average Home Value in this Area
Purchase History
We collect this data history from publicly available records. To have your information removed, we recommend requesting removal directly through your county’s website.
| Date | Buyer | Sale Price | Title Company |
|---|---|---|---|
| Frank Properties Llc | $90,000 | -- | |
| U S Bank National Association | $105,000 | Attorney | |
| Adams Don E | $150,000 | Premier Title Services | |
| Crowder Robert R | -- | -- | |
| Crowder Robert R | -- | -- |
Source: Public Records
Mortgage History
We collect this data history from publicly available records. To have your information removed, we recommend requesting removal directly through your county’s website.
| Date | Status | Borrower | Loan Amount |
|---|---|---|---|
| Closed | Frank Properties Llc | -- | |
| Previous Owner | Adams Don E | $120,000 |
Source: Public Records
Tax History
| Year | Tax Paid | Tax Assessment Tax Assessment Total Assessment is a certain percentage of the fair market value that is determined by local assessors to be the total taxable value of land and additions on the property. | Land | Improvement |
|---|---|---|---|---|
| 2025 | $3,825 | $45,900 | $8,810 | $37,090 |
| 2023 | $3,809 | $45,900 | $8,810 | $37,090 |
| 2022 | $3,093 | $32,445 | $8,295 | $24,150 |
| 2021 | $3,085 | $32,445 | $8,295 | $24,150 |
| 2020 | $3,098 | $32,445 | $8,295 | $24,150 |
| 2019 | $2,749 | $31,501 | $8,054 | $23,447 |
| 2018 | $2,757 | $31,501 | $8,054 | $23,447 |
| 2017 | $2,669 | $31,501 | $8,054 | $23,447 |
| 2016 | $4,054 | $48,227 | $9,671 | $38,556 |
| 2015 | $4,045 | $48,227 | $9,671 | $38,556 |
| 2014 | $3,982 | $48,227 | $9,671 | $38,556 |
| 2013 | $4,229 | $50,236 | $10,073 | $40,163 |
Source: Public Records
Map
Nearby Homes
- 1545 Mcmakin Ave
- 7821 Perry St
- 7508 Elizabeth St
- 1469 Hill Ave
- 1461 Kinney Ave
- 1524 Adams Rd
- 1914 Madison Ave
- 8001 Hamilton Ave Unit 27
- 1457 Adams Rd
- 7274 Elizabeth St
- 7849 Seward Ave
- 1970 Stevens Ave
- 1625 Joseph Ct
- 1650 Joseph Ct
- 1398 Adams Rd
- 1378 Adams Rd
- 7310 Forest Ave
- 1613 Norcol Ln
- 1725 Norcol Ln
- 1720 Marilyn Ln
- 7600 Hamilton Ave
- 7604 Hamilton Ave
- 7606 Hamilton Ave
- 1596 Compton Rd
- 7601 Hamilton Ave
- 7612 Hamilton Ave
- 1610 Compton Rd
- 7605 Hamilton Ave
- 7618 Hamilton Ave
- 7521 Hamilton Ave
- 1580 Compton Rd
- 7620 Hamilton Ave
- 7620 Hamilton Ave Unit 1
- 7620 Hamilton Ave Unit 4
- 7613 Hamilton Ave
- 7613 Perry St
- 7517 Hamilton Ave
- 7617 Hamilton Ave
- 7617 Perry St
- 7508 Hamilton Ave
Your Personal Tour Guide
Ask me questions while you tour the home.