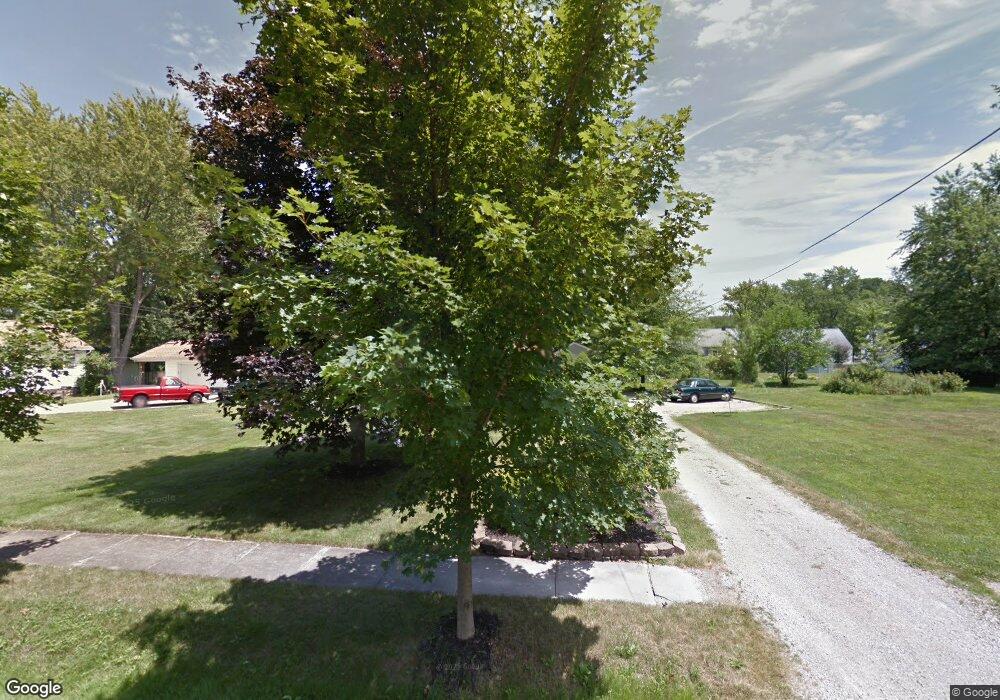
7603 Clark St Olmsted Falls, OH 44138
Estimated Value: $174,000 - $228,000
3
Beds
1
Bath
1,062
Sq Ft
$193/Sq Ft
Est. Value
About This Home
This home is located at 7603 Clark St, Olmsted Falls, OH 44138 and is currently estimated at $204,876, approximately $192 per square foot. 7603 Clark St is a home located in Cuyahoga County with nearby schools including Falls-Lenox Primary Elementary School, Olmsted Falls Intermediate Building, and Olmsted Falls Middle School.
Ownership History
Date
Name
Owned For
Owner Type
Purchase Details
Closed on
Sep 3, 1999
Sold by
Koesel Charlotte C
Bought by
Koesel Raymond R and Koesel Charlotte C
Current Estimated Value
Purchase Details
Closed on
Jun 1, 1983
Sold by
Collins William S
Bought by
Charlotte C Koesel
Purchase Details
Closed on
Jul 22, 1982
Sold by
Collins Catherine S
Bought by
Collins William S
Purchase Details
Closed on
Jan 1, 1975
Bought by
Collins Catherine S
Create a Home Valuation Report for This Property
The Home Valuation Report is an in-depth analysis detailing your home's value as well as a comparison with similar homes in the area
Home Values in the Area
Average Home Value in this Area
Purchase History
| Date | Buyer | Sale Price | Title Company |
|---|---|---|---|
| Koesel Raymond R | -- | -- | |
| Charlotte C Koesel | -- | -- | |
| Collins William S | -- | -- | |
| Collins Catherine S | -- | -- |
Source: Public Records
Tax History Compared to Growth
Tax History
| Year | Tax Paid | Tax Assessment Tax Assessment Total Assessment is a certain percentage of the fair market value that is determined by local assessors to be the total taxable value of land and additions on the property. | Land | Improvement |
|---|---|---|---|---|
| 2024 | $3,871 | $59,220 | $5,985 | $53,235 |
| 2023 | $3,343 | $42,880 | $10,050 | $32,830 |
| 2022 | $3,348 | $42,875 | $10,045 | $32,830 |
| 2021 | $2,755 | $42,880 | $10,050 | $32,830 |
| 2020 | $2,629 | $37,630 | $8,820 | $28,810 |
| 2019 | $2,333 | $107,500 | $25,200 | $82,300 |
| 2018 | $2,330 | $37,630 | $8,820 | $28,810 |
| 2017 | $2,315 | $35,250 | $7,630 | $27,620 |
| 2016 | $2,301 | $35,250 | $7,630 | $27,620 |
| 2015 | $2,133 | $35,250 | $7,630 | $27,620 |
| 2014 | $2,133 | $32,620 | $7,070 | $25,550 |
Source: Public Records
Map
Nearby Homes
- 25725 Cook Rd
- 27 Sycamore Dr
- 11 Concert Ct
- 7593 Columbia Rd
- 3 Concert Ln
- V/L Columbia Rd
- 5 Hawthorn Dr
- 3 Dogwood Ln
- 42 Periwinkle Dr
- 26685 Cranage Rd
- 52 Periwinkle Dr
- 11 Brookins Dr
- 55 Patio Ln
- 3 Fiddle Sticks
- 16 Van Ess Dr
- 281-12-024 River Rd
- 20 Van Ess Dr
- 281-12-007 River Rd
- 25950 Bagley Rd
- 7030 Columbia Rd