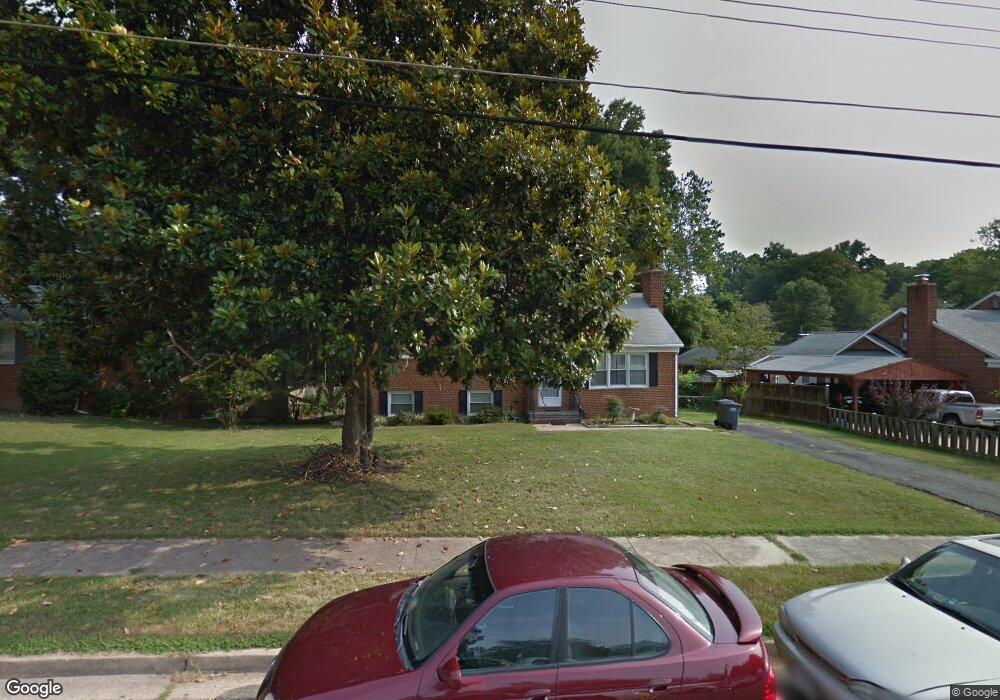
7603 Mendota Place Springfield, VA 22150
Estimated Value: $678,000 - $712,000
5
Beds
3
Baths
2,173
Sq Ft
$322/Sq Ft
Est. Value
About This Home
This home is located at 7603 Mendota Place, Springfield, VA 22150 and is currently estimated at $699,883, approximately $322 per square foot. 7603 Mendota Place is a home located in Fairfax County with nearby schools including Crestwood Elementary School, Key Middle, and Lewis High School.
Ownership History
Date
Name
Owned For
Owner Type
Purchase Details
Closed on
Jan 4, 2023
Sold by
Soulamany Christina T
Bought by
Soulamany Christina T and Somchanmavong Lai
Current Estimated Value
Purchase Details
Closed on
Dec 29, 2014
Sold by
Simanivanh Soumaly
Bought by
Soulamany Christina T
Home Financials for this Owner
Home Financials are based on the most recent Mortgage that was taken out on this home.
Original Mortgage
$417,302
Interest Rate
4.4%
Mortgage Type
FHA
Purchase Details
Closed on
Jul 29, 2005
Sold by
Helmantoler Willis L
Bought by
Simanivanh Soumaly and Simanivanh,Noy
Home Financials for this Owner
Home Financials are based on the most recent Mortgage that was taken out on this home.
Original Mortgage
$412,000
Interest Rate
5.67%
Mortgage Type
New Conventional
Create a Home Valuation Report for This Property
The Home Valuation Report is an in-depth analysis detailing your home's value as well as a comparison with similar homes in the area
Home Values in the Area
Average Home Value in this Area
Purchase History
| Date | Buyer | Sale Price | Title Company |
|---|---|---|---|
| Soulamany Christina T | -- | Elite Title & Escrow | |
| Soulamany Christina T | $425,000 | -- | |
| Simanivanh Soumaly | $515,000 | -- |
Source: Public Records
Mortgage History
| Date | Status | Borrower | Loan Amount |
|---|---|---|---|
| Previous Owner | Soulamany Christina T | $417,302 | |
| Previous Owner | Simanivanh Soumaly | $412,000 |
Source: Public Records
Tax History Compared to Growth
Tax History
| Year | Tax Paid | Tax Assessment Tax Assessment Total Assessment is a certain percentage of the fair market value that is determined by local assessors to be the total taxable value of land and additions on the property. | Land | Improvement |
|---|---|---|---|---|
| 2025 | $7,119 | $662,590 | $285,000 | $377,590 |
| 2024 | $7,119 | $614,480 | $265,000 | $349,480 |
| 2023 | $6,641 | $588,440 | $250,000 | $338,440 |
| 2022 | $6,456 | $564,560 | $240,000 | $324,560 |
| 2021 | $5,824 | $496,280 | $200,000 | $296,280 |
| 2020 | $5,625 | $475,290 | $195,000 | $280,290 |
| 2019 | $5,448 | $460,290 | $180,000 | $280,290 |
| 2018 | $5,146 | $447,510 | $170,000 | $277,510 |
| 2017 | $5,058 | $435,630 | $170,000 | $265,630 |
| 2016 | $4,871 | $420,420 | $160,000 | $260,420 |
| 2015 | $4,579 | $410,310 | $155,000 | $255,310 |
| 2014 | $4,430 | $397,870 | $150,000 | $247,870 |
Source: Public Records
Map
Nearby Homes
- 7412 Gary St
- 7424 Nancemond St
- 7402 Gary St
- 6303 Julian St
- 7403 Charlotte St
- 5920 Atteentee Rd
- 6517 Orono Ct
- 7317 Floyd Ave
- 7826 Glenister Dr
- 7757 Carrleigh Pkwy
- 7435 Bath St
- 5807 Accomac St
- 7156 Floyd Ave
- 6013 Hibbling Ave
- 7404 Oriole Ave
- 7938 Harwood Place
- 7212 Highland St
- 6313 Bardu Ave
- 7203 Tanager St
- 6815 Bluecurl Cir
- 7605 Mendota Place
- 7601 Mendota Place
- 6200 Middlesex Ave
- 7607 Mendota Place
- 7602 Mendota Place
- 7600 Mendota Place
- 7604 Mendota Place
- 7606 Mendota Place
- 7609 Mendota Place
- 7513 Mendota Place
- 7515 Nottoway Place
- 6206 Middlesex Ave
- 7608 Mendota Place
- 7512 Mendota Place
- 7611 Mendota Place
- 7512 Nottoway Place
- 6208 Middlesex Ave
- 7610 Mendota Place
- 6207 Middlesex Ave
- 7613 Mendota Place