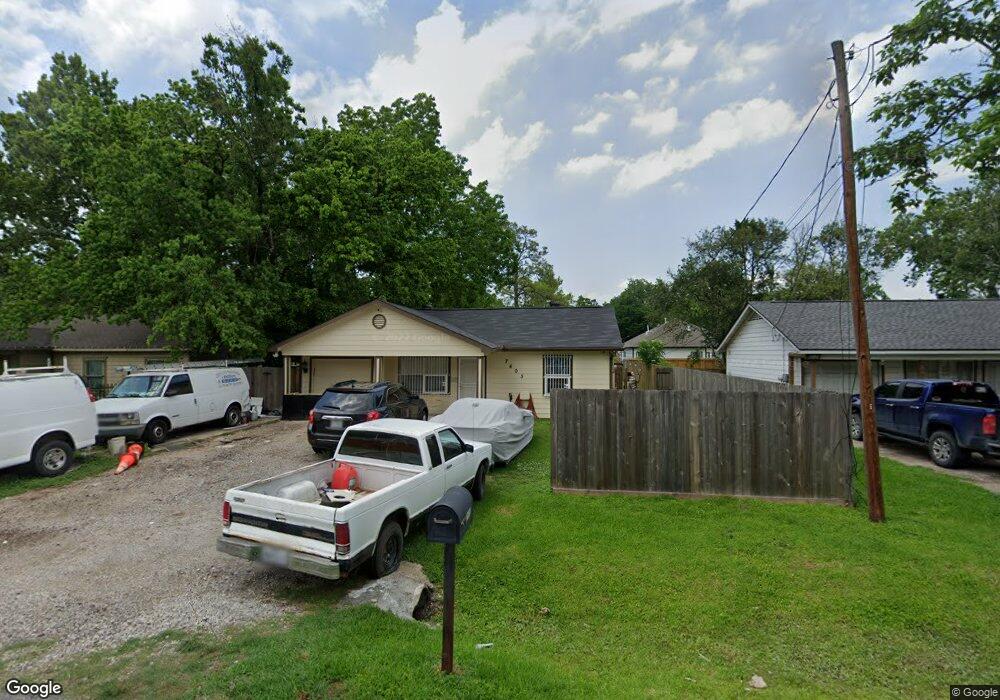
7605 Bellingham Dr Houston, TX 77028
Trinity-Houston Gardens NeighborhoodEstimated Value: $155,000 - $209,000
4
Beds
2
Baths
1,288
Sq Ft
$142/Sq Ft
Est. Value
About This Home
This home is located at 7605 Bellingham Dr, Houston, TX 77028 and is currently estimated at $182,952, approximately $142 per square foot. 7605 Bellingham Dr is a home located in Harris County with nearby schools including McGowen Elementary School, Key Middle, and Kashmere High School.
Ownership History
Date
Name
Owned For
Owner Type
Purchase Details
Closed on
Apr 15, 2021
Sold by
Zertuche Heriberto
Bought by
Zertuche Coral
Current Estimated Value
Purchase Details
Closed on
May 17, 2008
Sold by
Thomsen Henrik S
Bought by
Zertuche Heriberto and Zertuche Coral
Home Financials for this Owner
Home Financials are based on the most recent Mortgage that was taken out on this home.
Original Mortgage
$37,000
Outstanding Balance
$23,444
Interest Rate
5.89%
Mortgage Type
Seller Take Back
Estimated Equity
$159,508
Purchase Details
Closed on
Feb 28, 2008
Sold by
The Bank Of New York
Bought by
Thomsen Henrik
Purchase Details
Closed on
Nov 6, 2007
Sold by
Gentry Betty Jean
Bought by
The Bank Of New York
Purchase Details
Closed on
Mar 26, 1975
Sold by
Latson Albert and Latson Beverly E
Bought by
Gentry Betty Jean
Create a Home Valuation Report for This Property
The Home Valuation Report is an in-depth analysis detailing your home's value as well as a comparison with similar homes in the area
Home Values in the Area
Average Home Value in this Area
Purchase History
| Date | Buyer | Sale Price | Title Company |
|---|---|---|---|
| Zertuche Coral | -- | None Available | |
| Zertuche Heriberto | -- | Chicago Title | |
| Thomsen Henrik | -- | None Available | |
| The Bank Of New York | $27,391 | None Available | |
| Gentry Betty Jean | -- | -- |
Source: Public Records
Mortgage History
| Date | Status | Borrower | Loan Amount |
|---|---|---|---|
| Open | Zertuche Heriberto | $37,000 | |
| Closed | Gentry Betty Jean | $0 |
Source: Public Records
Tax History Compared to Growth
Tax History
| Year | Tax Paid | Tax Assessment Tax Assessment Total Assessment is a certain percentage of the fair market value that is determined by local assessors to be the total taxable value of land and additions on the property. | Land | Improvement |
|---|---|---|---|---|
| 2025 | $3,538 | $174,058 | $50,400 | $123,658 |
| 2024 | $3,538 | $169,072 | $50,400 | $118,672 |
| 2023 | $3,538 | $169,072 | $41,400 | $127,672 |
| 2022 | $2,892 | $131,330 | $27,360 | $103,970 |
| 2021 | $2,275 | $97,598 | $15,390 | $82,208 |
| 2020 | $1,707 | $70,471 | $10,260 | $60,211 |
| 2019 | $1,612 | $63,691 | $10,044 | $53,647 |
| 2018 | $544 | $21,495 | $9,000 | $12,495 |
| 2017 | $800 | $31,626 | $9,000 | $22,626 |
| 2016 | $800 | $31,626 | $9,000 | $22,626 |
| 2015 | $412 | $27,769 | $7,200 | $20,569 |
| 2014 | $412 | $16,026 | $7,200 | $8,826 |
Source: Public Records
Map
Nearby Homes
- 7527 Crofton St
- 7629 Teesdale Dr
- 7501 Crofton St
- 7423 Sundown Dr
- 7441 Fawnridge Dr
- 7423 Sundown3 Dr
- 0 Snowden St
- 9318 Sherbourne St
- 00 E Tidwell Rd
- 9313 Sherbourne St
- 7504 Laura Koppe Rd
- 7445 Laura Koppe
- 7817 Woodlyn Rd
- 7410 Glen Manor Dr
- 7828 Homewood Ln
- 7625 Touchstone St
- 7909 Lynette St
- 7901 Homewood Ln
- 9412 Firnat St Unit A-B
- 7610 Touchstone St
- 7609 Bellingham Dr
- 7601 Bellingham Dr
- 7613 Bellingham Dr
- 7606 Teesdale Dr
- 7602 Teesdale Dr
- 7610 Teesdale Dr
- 7614 Teesdale Dr
- 7617 Bellingham Dr
- 7606 Bellingham Dr
- 7602 Bellingham Dr
- 7610 Bellingham Dr Unit A
- 7610 Bellingham Dr Unit B
- 7618 Teesdale Dr
- 7614 Bellingham Dr
- 9217 Levering Ln
- 7621 Bellingham Dr
- 9221 Levering Ln
- 9213 Levering Ln
- 7618 Bellingham Dr
- 9225 Levering Ln