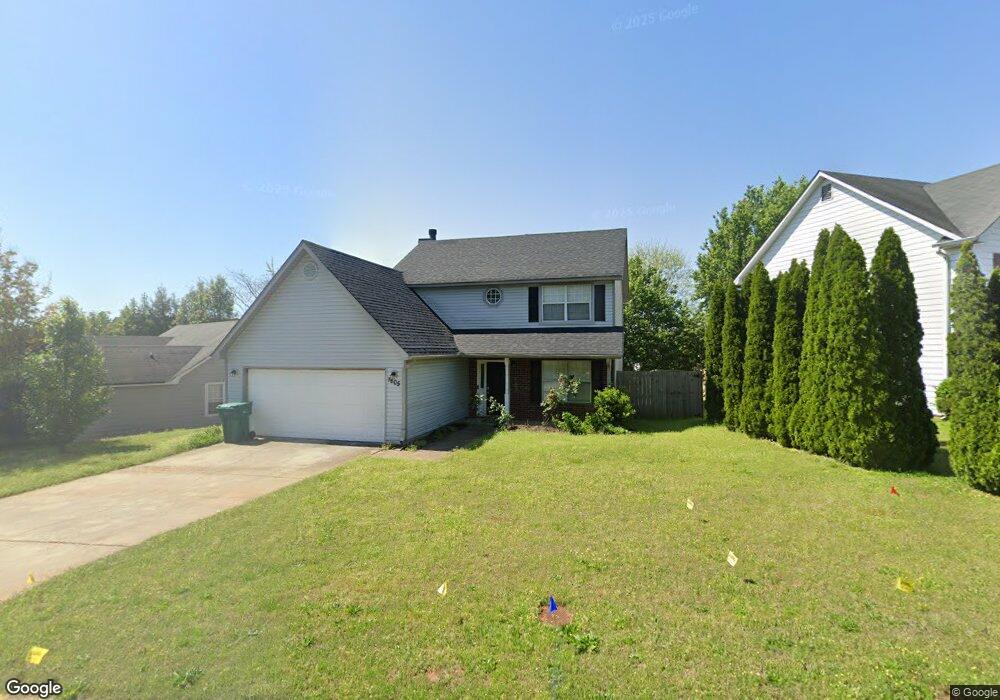
7605 Briar Crest Ct Unit 36 Riverdale, GA 30296
Estimated Value: $207,000 - $286,000
3
Beds
3
Baths
1,710
Sq Ft
$142/Sq Ft
Est. Value
About This Home
This home is located at 7605 Briar Crest Ct Unit 36, Riverdale, GA 30296 and is currently estimated at $243,460, approximately $142 per square foot. 7605 Briar Crest Ct Unit 36 is a home located in Clayton County with nearby schools including Lake Ridge Elementary School, Kendrick Middle School, and Riverdale High School.
Ownership History
Date
Name
Owned For
Owner Type
Purchase Details
Closed on
Sep 21, 2021
Sold by
Southern Oaks Property Solutions Llc
Bought by
Yamasa Co Ltd
Current Estimated Value
Purchase Details
Closed on
Sep 3, 2021
Sold by
Thomas Smokes John
Bought by
Southern Oak Property Solutions Llc
Purchase Details
Closed on
Dec 28, 2018
Sold by
A Plus Llc
Bought by
Thomas-Smokes John
Purchase Details
Closed on
Sep 4, 2018
Sold by
Green Risa D
Bought by
A Plus Llc
Purchase Details
Closed on
Aug 27, 2001
Sold by
Rosingnon Oacar
Bought by
Green Risa D
Home Financials for this Owner
Home Financials are based on the most recent Mortgage that was taken out on this home.
Original Mortgage
$123,028
Interest Rate
6.98%
Mortgage Type
FHA
Purchase Details
Closed on
Feb 29, 1996
Sold by
Amesbury Corp
Bought by
Rosignon Oscar
Create a Home Valuation Report for This Property
The Home Valuation Report is an in-depth analysis detailing your home's value as well as a comparison with similar homes in the area
Home Values in the Area
Average Home Value in this Area
Purchase History
| Date | Buyer | Sale Price | Title Company |
|---|---|---|---|
| Yamasa Co Ltd | $245,000 | -- | |
| Southern Oak Property Solutions Llc | $190,000 | -- | |
| Thomas-Smokes John | $150,000 | -- | |
| A Plus Llc | $93,000 | -- | |
| Green Risa D | $124,000 | -- | |
| Rosignon Oscar | $91,500 | -- |
Source: Public Records
Mortgage History
| Date | Status | Borrower | Loan Amount |
|---|---|---|---|
| Previous Owner | Green Risa D | $123,028 | |
| Closed | Rosignon Oscar | $0 |
Source: Public Records
Tax History Compared to Growth
Tax History
| Year | Tax Paid | Tax Assessment Tax Assessment Total Assessment is a certain percentage of the fair market value that is determined by local assessors to be the total taxable value of land and additions on the property. | Land | Improvement |
|---|---|---|---|---|
| 2024 | $3,646 | $102,480 | $8,000 | $94,480 |
| 2023 | $2,440 | $94,520 | $8,000 | $86,520 |
| 2022 | $3,094 | $77,880 | $8,000 | $69,880 |
| 2021 | $1,875 | $56,520 | $8,000 | $48,520 |
| 2020 | $1,674 | $50,900 | $8,000 | $42,900 |
| 2019 | $1,985 | $47,957 | $6,000 | $41,957 |
| 2018 | $1,773 | $42,731 | $6,000 | $36,731 |
| 2017 | $1,262 | $30,070 | $6,400 | $23,670 |
| 2016 | $1,000 | $23,651 | $6,400 | $17,251 |
| 2015 | $992 | $0 | $0 | $0 |
| 2014 | $901 | $21,710 | $6,400 | $15,310 |
Source: Public Records
Map
Nearby Homes
- 1124 E Briar Gate Ct
- 7737 Bar Harbor Dr
- 7617 Lakemoor Dr
- 0 Sugarcreek Way Unit 10572882
- 0 Sugarcreek Way Unit 7622149
- 955 Loch Forest Way
- 7748 Bernardo Dr
- 1320 Revelstoke Cove
- 338 Saratoga Place
- 1346 Revelstoke Cove
- 1366 Hollenbeck Ln
- 7693 Creekside Ln
- 7694 Creekside Ln
- 7438 Chilton Ln
- 7356 Caribou Trail
- 0 Creekside Ln Unit 10582617
- 0 Creekside Ln Unit 7631178
- 828 Commerce Blvd
- 1464 Riverrock Trail
- 7605 Briar Crest Ct
- 7599 Briar Crest Ct
- 7617 Briar Crest Ct
- 1155 W Briar Gate Ct
- 7593 Briar Crest Ct
- 1161 W Briar Gate Ct
- 7625 Briar Crest Ct
- 7625 Briar Crest Ct Unit 34
- 1143 Briar Cove Ct
- 7604 Briar Crest Ct
- 7610 Briar Crest Ct
- 0 Briar Crest Ct Unit 8651457
- 0 Briar Crest Ct Unit 7168486
- 0 Briar Crest Ct Unit 7014083
- 0 Briar Crest Ct Unit 9079038
- 0 Briar Crest Ct Unit 8747848
- 0 Briar Crest Ct Unit 8787450
- 0 Briar Crest Ct Unit 3173789
- 0 Briar Crest Ct Unit 7370403
- 0 Briar Crest Ct