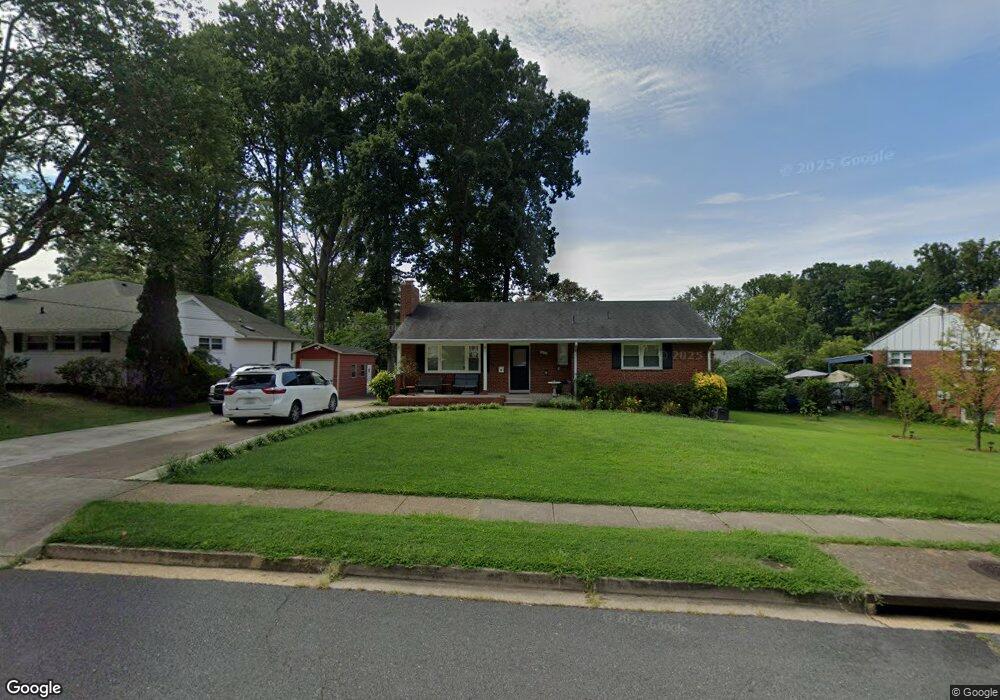
7605 Jervis St Springfield, VA 22151
Estimated Value: $715,040 - $821,000
5
Beds
3
Baths
1,448
Sq Ft
$515/Sq Ft
Est. Value
About This Home
This home is located at 7605 Jervis St, Springfield, VA 22151 and is currently estimated at $746,010, approximately $515 per square foot. 7605 Jervis St is a home located in Fairfax County with nearby schools including North Springfield Elementary School, Holmes Middle School, and Annandale High School.
Ownership History
Date
Name
Owned For
Owner Type
Purchase Details
Closed on
Nov 20, 2009
Sold by
Nguyen Ngoc Nhu
Bought by
Raisinger Jan Lukas
Current Estimated Value
Home Financials for this Owner
Home Financials are based on the most recent Mortgage that was taken out on this home.
Original Mortgage
$425,950
Outstanding Balance
$276,131
Interest Rate
4.86%
Mortgage Type
VA
Estimated Equity
$469,879
Purchase Details
Closed on
Sep 8, 2009
Sold by
Deutshce Bank Natl Tr Co
Bought by
Nguyen Ngoc Nhu
Purchase Details
Closed on
Jun 29, 2006
Sold by
Hunyh Lam Ba
Bought by
Merida Rosmery E
Home Financials for this Owner
Home Financials are based on the most recent Mortgage that was taken out on this home.
Original Mortgage
$440,000
Interest Rate
6.58%
Mortgage Type
New Conventional
Purchase Details
Closed on
Oct 27, 1998
Sold by
Guy Kathryn
Bought by
Hunyh Lam Ba
Home Financials for this Owner
Home Financials are based on the most recent Mortgage that was taken out on this home.
Original Mortgage
$80,000
Interest Rate
6.68%
Create a Home Valuation Report for This Property
The Home Valuation Report is an in-depth analysis detailing your home's value as well as a comparison with similar homes in the area
Home Values in the Area
Average Home Value in this Area
Purchase History
| Date | Buyer | Sale Price | Title Company |
|---|---|---|---|
| Raisinger Jan Lukas | $430,000 | -- | |
| Nguyen Ngoc Nhu | $305,000 | -- | |
| Merida Rosmery E | $550,000 | -- | |
| Hunyh Lam Ba | $175,000 | -- |
Source: Public Records
Mortgage History
| Date | Status | Borrower | Loan Amount |
|---|---|---|---|
| Open | Raisinger Jan Lukas | $425,950 | |
| Previous Owner | Merida Rosmery E | $440,000 | |
| Previous Owner | Hunyh Lam Ba | $80,000 |
Source: Public Records
Tax History
| Year | Tax Paid | Tax Assessment Tax Assessment Total Assessment is a certain percentage of the fair market value that is determined by local assessors to be the total taxable value of land and additions on the property. | Land | Improvement |
|---|---|---|---|---|
| 2025 | $8,389 | $702,560 | $281,000 | $421,560 |
| 2024 | $8,389 | $724,110 | $266,000 | $458,110 |
| 2023 | $8,062 | $714,410 | $256,000 | $458,410 |
| 2022 | $7,556 | $660,780 | $226,000 | $434,780 |
| 2021 | $6,836 | $582,500 | $208,000 | $374,500 |
| 2020 | $7,602 | $571,590 | $208,000 | $363,590 |
| 2019 | $6,765 | $571,590 | $208,000 | $363,590 |
| 2018 | $6,193 | $538,540 | $208,000 | $330,540 |
| 2017 | $5,930 | $510,800 | $196,000 | $314,800 |
| 2016 | $5,802 | $500,800 | $186,000 | $314,800 |
Source: Public Records
Map
Nearby Homes
- 7727 Kalorama Rd
- 4917 Erie St
- 7314 Inzer St
- 7318 Chatham St
- 7304 Inzer St
- 7331 Calvert St
- 7706 Arlen St
- 7343 Calvert St
- 5504 Kathleen Place
- 4938 Sauquoit Ln
- 4936 Sauquoit Ln
- 4960 Schuyler Dr
- 7313 Byrneley Ln
- 5300 Easton Dr
- 4909A Americana Dr Unit A
- 4909 Americana Dr Unit 106
- 4901 Americana Dr Unit 202
- 4903 Americana Dr Unit T7
- 4900 Schuyler Dr
- 7324 Auburn St
- 7603 Jervis St
- 7607 Jervis St
- 7602 Ingle Place
- 7604 Ingle Place
- 5203 Kipling St
- 7604 Jervis St
- 5205 Kipling St
- 7606 Jervis St
- 5204 Ravensworth Rd
- 7602 Jervis St
- 5202 Ravensworth Rd
- 5206 Ravensworth Rd
- 7608 Jervis St
- 5207 Kipling St
- 7600 Jervis St
- 7605 Ingle Place
- 5209 Kipling St
- 7528 Jervis St
- 5200 Ravensworth Rd
- 5202 Kipling St
Your Personal Tour Guide
Ask me questions while you tour the home.