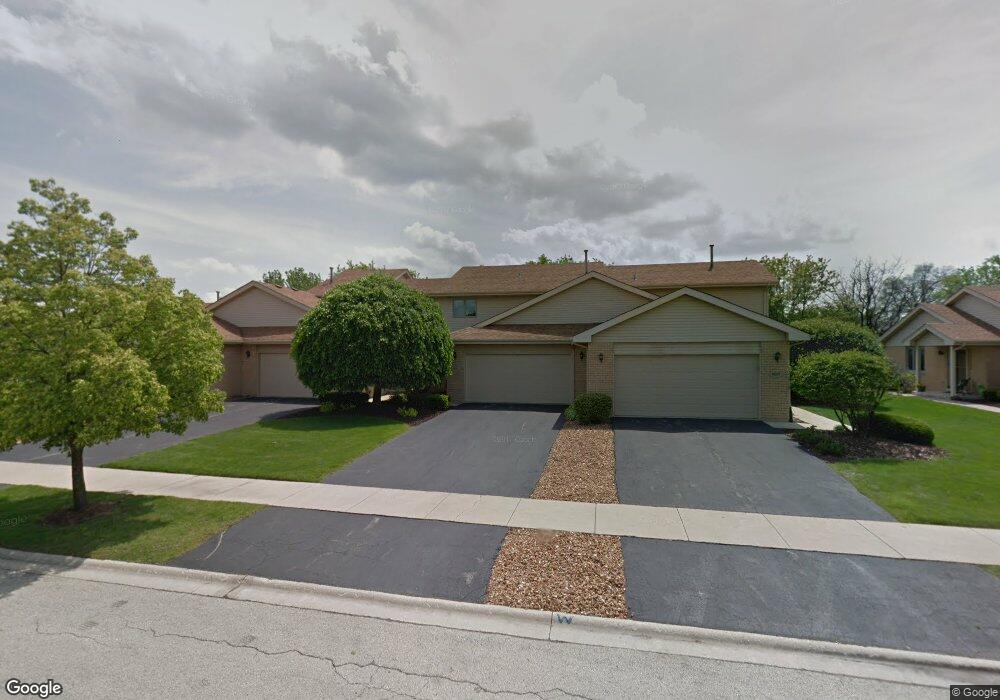
7605 W 158th Ct Unit 7605 Orland Park, IL 60462
Silver Lake South NeighborhoodEstimated Value: $277,436 - $334,000
2
Beds
2
Baths
1,658
Sq Ft
$188/Sq Ft
Est. Value
About This Home
This home is located at 7605 W 158th Ct Unit 7605, Orland Park, IL 60462 and is currently estimated at $311,359, approximately $187 per square foot. 7605 W 158th Ct Unit 7605 is a home located in Cook County with nearby schools including Arnold W Kruse Education Center, Central Middle School, and Victor J Andrew High School.
Ownership History
Date
Name
Owned For
Owner Type
Purchase Details
Closed on
Dec 1, 1999
Sold by
Davoren Eileen A
Bought by
Kopp George W and Kopp Laurice
Current Estimated Value
Home Financials for this Owner
Home Financials are based on the most recent Mortgage that was taken out on this home.
Original Mortgage
$110,000
Outstanding Balance
$34,721
Interest Rate
7.97%
Mortgage Type
Purchase Money Mortgage
Estimated Equity
$276,638
Purchase Details
Closed on
Feb 20, 1998
Sold by
Davoren John J
Bought by
Davoren Ellen A
Home Financials for this Owner
Home Financials are based on the most recent Mortgage that was taken out on this home.
Original Mortgage
$108,000
Interest Rate
6.5%
Mortgage Type
Purchase Money Mortgage
Purchase Details
Closed on
Jan 5, 1997
Sold by
First National Bank Of Evergreen Park
Bought by
Davoren John J and Davoren Eileen A
Purchase Details
Closed on
Apr 19, 1994
Sold by
Kolwyck Aaron C and Kolwyck Gertrude
Bought by
First National Bank Of Evergreen Park
Create a Home Valuation Report for This Property
The Home Valuation Report is an in-depth analysis detailing your home's value as well as a comparison with similar homes in the area
Home Values in the Area
Average Home Value in this Area
Purchase History
| Date | Buyer | Sale Price | Title Company |
|---|---|---|---|
| Kopp George W | $155,000 | -- | |
| Davoren Ellen A | -- | -- | |
| Davoren John J | $139,000 | -- | |
| First National Bank Of Evergreen Park | -- | -- |
Source: Public Records
Mortgage History
| Date | Status | Borrower | Loan Amount |
|---|---|---|---|
| Open | Kopp George W | $110,000 | |
| Previous Owner | Davoren Ellen A | $108,000 |
Source: Public Records
Tax History Compared to Growth
Tax History
| Year | Tax Paid | Tax Assessment Tax Assessment Total Assessment is a certain percentage of the fair market value that is determined by local assessors to be the total taxable value of land and additions on the property. | Land | Improvement |
|---|---|---|---|---|
| 2024 | $5,785 | $23,788 | $3,673 | $20,115 |
| 2023 | $4,671 | $23,788 | $3,673 | $20,115 |
| 2022 | $4,671 | $17,201 | $3,232 | $13,969 |
| 2021 | $4,616 | $17,200 | $3,232 | $13,968 |
| 2020 | $4,686 | $17,200 | $3,232 | $13,968 |
| 2019 | $4,818 | $17,894 | $2,938 | $14,956 |
| 2018 | $4,716 | $17,894 | $2,938 | $14,956 |
| 2017 | $4,636 | $17,894 | $2,938 | $14,956 |
| 2016 | $4,385 | $14,932 | $2,644 | $12,288 |
| 2015 | $5,202 | $14,932 | $2,644 | $12,288 |
| 2014 | $3,618 | $14,932 | $2,644 | $12,288 |
| 2013 | $4,342 | $16,339 | $2,644 | $13,695 |
Source: Public Records
Map
Nearby Homes
- 16447 S 76th Ave
- 7686 159th Place Unit 38
- 7732 W 158th Ct Unit 7732
- 7823 W 157th Place Unit 1W
- 7405 W 157th St
- 7747 Cashew Dr
- 15957 78th Ave
- 15962 78th Ave
- 15954 78th Ave
- 7809 160th St
- 15662 Wild Rose Ln Unit 12
- 7911 W 157th St Unit 2W
- 7533 161st Place
- 15960 Ashford Ct
- 7503 161st Place
- 7842 Sea Pines Rd
- 7901 160th St
- 7825 Braeloch Ct
- 15602 Violet Ct Unit 31
- 16157 Ozark Ave
- 7603 W 158th Ct Unit 7603
- 7601 W 158th Ct Unit 7601
- 7607 W 158th Ct Unit 7607
- 7617 W 158th Ct Unit 7617
- 7619 W 158th Ct Unit 7619
- 7604 W 158th Ct Unit 7604
- 7621 W 158th Ct Unit 7621
- 7606 W 158th Ct Unit 7606
- 7602 W 158th Ct Unit 7602
- 7630 W 159th St
- 7600 W 158th Ct Unit 7600
- 7600 W 158th Ct Unit 1
- 7614 W 158th Ct Unit 7614
- 7616 W 158th Ct Unit 7616
- 15811 S 76th Ave Unit 1G
- 15811 S 76th Ave Unit 158111H
- 15811 S 76th Ave Unit G15811
- 15811 S 76th Ave Unit 158112H
- 15811 S 76th Ave Unit 158112G
- 15811 S 76th Ave Unit 158111G