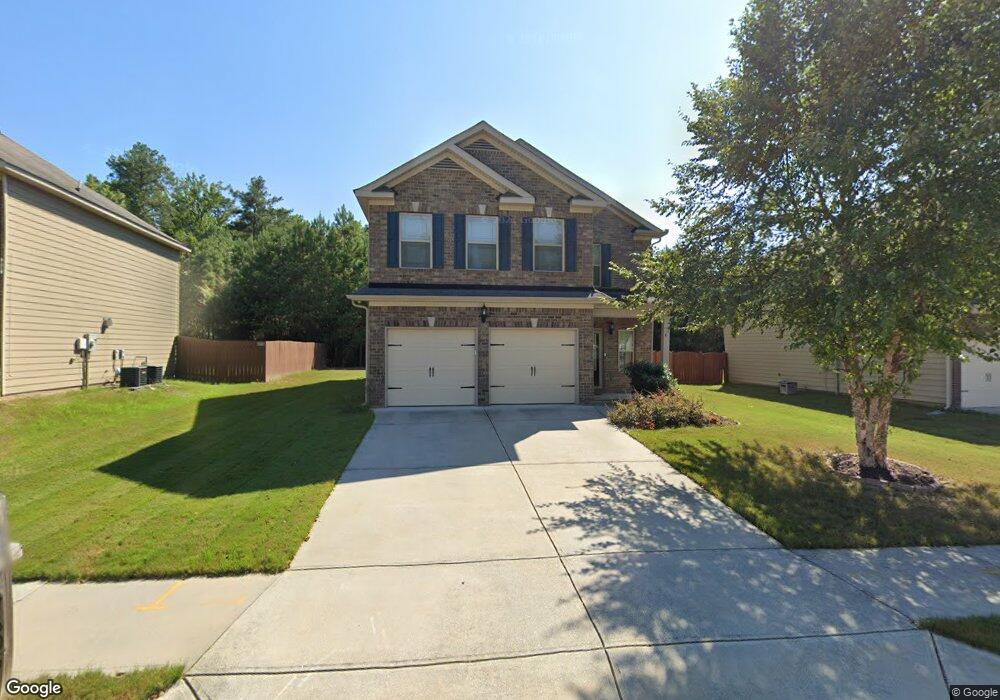
7606 Absinth Dr Atlanta, GA 30349
Estimated Value: $334,944 - $397,000
5
Beds
3
Baths
2,640
Sq Ft
$138/Sq Ft
Est. Value
About This Home
This home is located at 7606 Absinth Dr, Atlanta, GA 30349 and is currently estimated at $364,736, approximately $138 per square foot. 7606 Absinth Dr is a home located in Fulton County with nearby schools including Cliftondale Elementary School, Renaissance Middle School, and Langston Hughes High School.
Ownership History
Date
Name
Owned For
Owner Type
Purchase Details
Closed on
Apr 28, 2017
Sold by
Brickstone Properties Llc
Bought by
Callum Dormaine N
Current Estimated Value
Home Financials for this Owner
Home Financials are based on the most recent Mortgage that was taken out on this home.
Original Mortgage
$195,395
Outstanding Balance
$163,814
Interest Rate
4.4%
Mortgage Type
FHA
Estimated Equity
$200,922
Purchase Details
Closed on
Aug 2, 2016
Sold by
Frederick
Bought by
Brickstone Properties Llc and F P Investments Llc
Purchase Details
Closed on
Jan 18, 2012
Sold by
Peachtree Communities At P
Bought by
Camp Frederick
Home Financials for this Owner
Home Financials are based on the most recent Mortgage that was taken out on this home.
Original Mortgage
$145,220
Interest Rate
3.97%
Mortgage Type
FHA
Purchase Details
Closed on
Aug 8, 2011
Sold by
Palmetto Farms Grp Llc
Bought by
Peachtree Communities At Palme
Create a Home Valuation Report for This Property
The Home Valuation Report is an in-depth analysis detailing your home's value as well as a comparison with similar homes in the area
Home Values in the Area
Average Home Value in this Area
Purchase History
| Date | Buyer | Sale Price | Title Company |
|---|---|---|---|
| Callum Dormaine N | $199,000 | -- | |
| Brickstone Properties Llc | $163,000 | -- | |
| Camp Frederick | $149,026 | -- | |
| Peachtree Communities At Palme | $15,000 | -- |
Source: Public Records
Mortgage History
| Date | Status | Borrower | Loan Amount |
|---|---|---|---|
| Open | Callum Dormaine N | $195,395 | |
| Previous Owner | Camp Frederick | $145,220 |
Source: Public Records
Tax History Compared to Growth
Tax History
| Year | Tax Paid | Tax Assessment Tax Assessment Total Assessment is a certain percentage of the fair market value that is determined by local assessors to be the total taxable value of land and additions on the property. | Land | Improvement |
|---|---|---|---|---|
| 2025 | $1,672 | $134,440 | $40,840 | $93,600 |
| 2023 | $3,840 | $136,040 | $25,920 | $110,120 |
| 2022 | $1,563 | $130,280 | $16,000 | $114,280 |
| 2021 | $1,522 | $89,040 | $13,240 | $75,800 |
| 2020 | $1,518 | $88,000 | $13,080 | $74,920 |
| 2019 | $1,709 | $75,840 | $11,640 | $64,200 |
| 2018 | $2,166 | $78,480 | $11,360 | $67,120 |
| 2017 | $2,123 | $52,080 | $7,840 | $44,240 |
| 2016 | $2,123 | $52,080 | $7,840 | $44,240 |
| 2015 | $2,129 | $52,080 | $7,840 | $44,240 |
| 2014 | $2,246 | $52,080 | $7,840 | $44,240 |
Source: Public Records
Map
Nearby Homes
- 7739 Wrotham Cir
- 7720 Wrotham Cir
- 7729 Sylvaner Ln
- 7808 Wrotham Cir
- 3114 Thicket Ln
- 3144 Fonseca Pass
- 7644 Wrotham Cir
- 520 Pickford Place
- 7470 Thoreau Cir Unit 13
- 0 Cochran Rd Unit 7674445
- 0 Cochran Rd Unit 10635082
- 7425 Thoreau Cir
- 3495 Davis Blvd
- 450 Pinevale Ct
- 2980 Oxford Rd
- 2590 Gilbert Branch
- 7513 Cole Ln
- 640 Fitzgerald Place
- 3239 Timber Ridge
- 0 W Stubbs Rd Unit (11.4 ACRES)
- 7606 Absinth Dr Unit 46
- 7602 Absinth Dr
- 7610 Absinth Dr
- 7614 Absinth Dr
- 7598 Absinth Dr
- 7605 Absinth Dr
- 7609 Absinth Dr
- 7601 Absinth Dr
- 7594 Absinth Dr
- 7597 Absinth Dr
- 7618 Absinth Dr
- 7613 Absinth Dr
- 7590 Absinth Dr
- 7590 Absinth Dr
- 7617 Absinth Dr
- 7622 Absinth Dr
- 7593 Absinth Dr
- 7586 Absinth Dr
- 7586 Absinth Dr Unit A1
- 7589 Absinth Dr