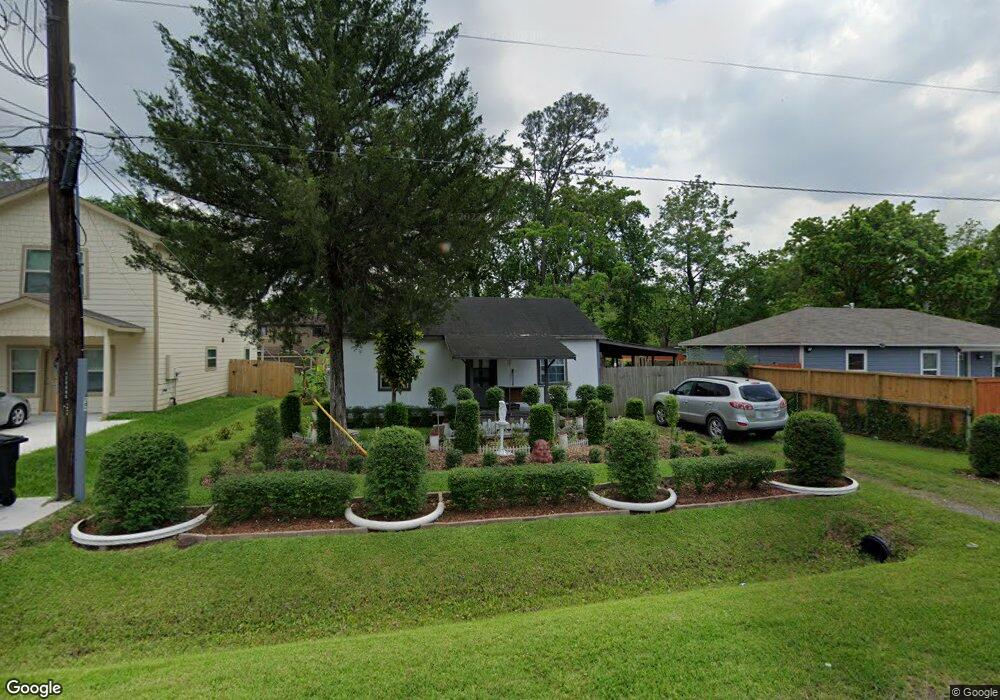
7606 Bellingham Dr Houston, TX 77028
Trinity-Houston Gardens NeighborhoodEstimated Value: $114,449 - $164,000
2
Beds
1
Bath
720
Sq Ft
$191/Sq Ft
Est. Value
About This Home
This home is located at 7606 Bellingham Dr, Houston, TX 77028 and is currently estimated at $137,612, approximately $191 per square foot. 7606 Bellingham Dr is a home located in Harris County with nearby schools including McGowen Elementary School, Key Middle, and Kashmere High School.
Ownership History
Date
Name
Owned For
Owner Type
Purchase Details
Closed on
Oct 20, 2025
Sold by
Williams Henry L
Bought by
Texas Quick Home Buyer Llc
Current Estimated Value
Home Financials for this Owner
Home Financials are based on the most recent Mortgage that was taken out on this home.
Original Mortgage
$101,600
Outstanding Balance
$101,600
Interest Rate
6.35%
Mortgage Type
Construction
Estimated Equity
$36,012
Purchase Details
Closed on
Mar 8, 1999
Sold by
Resources Jabe
Bought by
Williams Henry L
Purchase Details
Closed on
Feb 3, 1999
Sold by
Moran Josaphat and Moran Josie Lee
Bought by
Jabe Resource
Purchase Details
Closed on
Aug 4, 1997
Sold by
Jabe Resources
Bought by
Moran Josephat and Moran Jose Lee
Purchase Details
Closed on
Jul 3, 1997
Sold by
Farrell Betty
Bought by
Jabe Resources
Purchase Details
Closed on
Aug 3, 1992
Sold by
Millar Cindy A
Bought by
Jabe Resources
Create a Home Valuation Report for This Property
The Home Valuation Report is an in-depth analysis detailing your home's value as well as a comparison with similar homes in the area
Home Values in the Area
Average Home Value in this Area
Purchase History
| Date | Buyer | Sale Price | Title Company |
|---|---|---|---|
| Texas Quick Home Buyer Llc | -- | Capital Title | |
| Williams Henry L | -- | -- | |
| Jabe Resource | $7,600 | -- | |
| Moran Josephat | -- | -- | |
| Jabe Resources | $3,000 | -- | |
| Jabe Resources | -- | -- | |
| Jabe Resources | -- | -- |
Source: Public Records
Mortgage History
| Date | Status | Borrower | Loan Amount |
|---|---|---|---|
| Open | Texas Quick Home Buyer Llc | $101,600 |
Source: Public Records
Tax History Compared to Growth
Tax History
| Year | Tax Paid | Tax Assessment Tax Assessment Total Assessment is a certain percentage of the fair market value that is determined by local assessors to be the total taxable value of land and additions on the property. | Land | Improvement |
|---|---|---|---|---|
| 2025 | $758 | $101,327 | $50,526 | $50,801 |
| 2024 | $758 | $98,525 | $50,526 | $47,999 |
| 2023 | $758 | $93,068 | $41,504 | $51,564 |
| 2022 | $753 | $69,757 | $27,428 | $42,329 |
| 2021 | $725 | $49,068 | $15,428 | $33,640 |
| 2020 | $685 | $35,843 | $10,286 | $25,557 |
| 2019 | $651 | $32,933 | $10,069 | $22,864 |
| 2018 | $0 | $10,681 | $9,023 | $1,658 |
| 2017 | $582 | $23,021 | $9,023 | $13,998 |
| 2016 | $538 | $23,021 | $9,023 | $13,998 |
| 2015 | -- | $19,337 | $7,218 | $12,119 |
| 2014 | -- | $19,337 | $7,218 | $12,119 |
Source: Public Records
Map
Nearby Homes
- 7527 Crofton St
- 7629 Teesdale Dr
- 7501 Crofton St
- 7423 Sundown Dr
- 7441 Fawnridge Dr
- 7423 Sundown3 Dr
- 0 Snowden St
- 9318 Sherbourne St
- 00 E Tidwell Rd
- 9313 Sherbourne St
- 7504 Laura Koppe Rd
- 7445 Laura Koppe
- 7817 Woodlyn Rd
- 7410 Glen Manor Dr
- 7828 Homewood Ln
- 7625 Touchstone St
- 7909 Lynette St
- 9437 Pembrook St
- 7901 Homewood Ln
- 9412 Firnat St Unit A-B
- 7610 Bellingham Dr Unit A
- 7610 Bellingham Dr Unit B
- 7614 Bellingham Dr
- 7602 Bellingham Dr
- 7609 Crofton St
- 9202 Levering Ln
- 7618 Bellingham Dr
- 7613 Crofton St
- 7609 Bellingham Dr
- 7605 Bellingham Dr
- 7615 Crofton St
- 7613 Bellingham Dr
- 7601 Bellingham Dr
- 7622 Bellingham Dr
- 7621 Crofton St
- 7617 Bellingham Dr
- 9205 Levering Ln
- 9201 Levering Ln
- 9209 Levering Ln
- 7626 Bellingham Dr