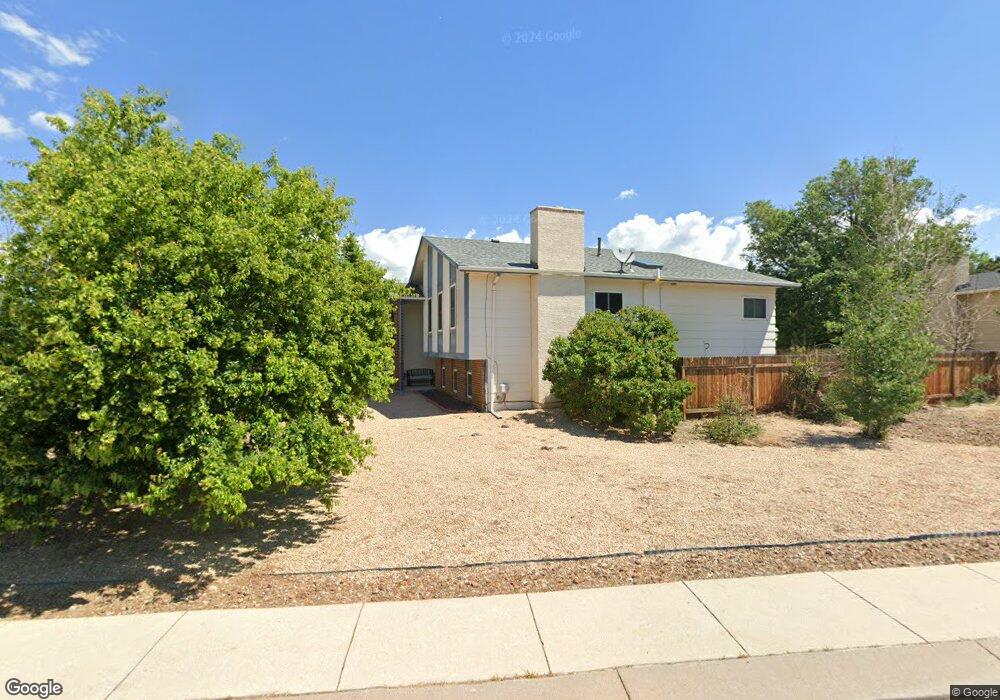
7606 Safari Cir Colorado Springs, CO 80920
Briargate NeighborhoodEstimated Value: $415,776 - $451,000
4
Beds
2
Baths
1,088
Sq Ft
$404/Sq Ft
Est. Value
About This Home
This home is located at 7606 Safari Cir, Colorado Springs, CO 80920 and is currently estimated at $439,194, approximately $403 per square foot. 7606 Safari Cir is a home located in El Paso County with nearby schools including Frontier Elementary School, Mountain Ridge Middle School, and Rampart High School.
Ownership History
Date
Name
Owned For
Owner Type
Purchase Details
Closed on
Sep 24, 2015
Sold by
Weitzer Deborah L
Bought by
Bell Lee R and Bell Juanita H
Current Estimated Value
Home Financials for this Owner
Home Financials are based on the most recent Mortgage that was taken out on this home.
Original Mortgage
$172,320
Outstanding Balance
$135,715
Interest Rate
3.99%
Mortgage Type
New Conventional
Estimated Equity
$303,479
Purchase Details
Closed on
Oct 23, 1998
Sold by
Knowles David L and Knowles Kellie J
Bought by
Weltzer Lonny P and Weltzer Deborah L
Home Financials for this Owner
Home Financials are based on the most recent Mortgage that was taken out on this home.
Original Mortgage
$108,800
Interest Rate
6.61%
Purchase Details
Closed on
Oct 2, 1989
Bought by
Bell Lee R
Purchase Details
Closed on
Dec 1, 1981
Bought by
Bell Lee R
Purchase Details
Closed on
Sep 21, 1981
Bought by
Bell Lee R
Create a Home Valuation Report for This Property
The Home Valuation Report is an in-depth analysis detailing your home's value as well as a comparison with similar homes in the area
Home Values in the Area
Average Home Value in this Area
Purchase History
| Date | Buyer | Sale Price | Title Company |
|---|---|---|---|
| Bell Lee R | $215,400 | Unified Title Co | |
| Weltzer Lonny P | $136,000 | -- | |
| Bell Lee R | $83,000 | -- | |
| Bell Lee R | -- | -- | |
| Bell Lee R | -- | -- |
Source: Public Records
Mortgage History
| Date | Status | Borrower | Loan Amount |
|---|---|---|---|
| Open | Bell Lee R | $172,320 | |
| Previous Owner | Weltzer Lonny P | $108,800 |
Source: Public Records
Tax History Compared to Growth
Tax History
| Year | Tax Paid | Tax Assessment Tax Assessment Total Assessment is a certain percentage of the fair market value that is determined by local assessors to be the total taxable value of land and additions on the property. | Land | Improvement |
|---|---|---|---|---|
| 2025 | $1,832 | $31,090 | -- | -- |
| 2024 | $1,787 | $32,350 | $5,360 | $26,990 |
| 2022 | $1,560 | $22,100 | $4,340 | $17,760 |
| 2021 | $1,624 | $22,730 | $4,460 | $18,270 |
| 2020 | $1,560 | $20,270 | $3,720 | $16,550 |
| 2019 | $1,544 | $20,270 | $3,720 | $16,550 |
| 2018 | $1,245 | $16,060 | $2,880 | $13,180 |
| 2017 | $1,240 | $16,060 | $2,880 | $13,180 |
| 2016 | $1,121 | $14,500 | $2,930 | $11,570 |
| 2015 | $1,119 | $14,500 | $2,930 | $11,570 |
| 2014 | $1,046 | $13,550 | $2,930 | $10,620 |
Source: Public Records
Map
Nearby Homes
- 7640 Gibralter Dr
- 7530 Madrid Ct
- 7420 Lomas Ct
- 7430 Lomas Ct
- 2553 Legend Dr
- 8146 Horizon Dr
- 2768 Thrush Grove
- 2615 Thrush Grove
- 7849 Flicker Grove
- 2507 Legend Terrace
- 3339 Union Jack Way
- 3315 Mexico Ct
- 2650 Bannister Ct
- 3326 Soaring Bird Cir
- 2512 Elite Terrace
- 7644 Lexington Manor Dr
- 7636 Lexington Manor Dr
- 3329 Misty Meadows Dr
- 3142 Soaring Bird Cir
- 3455 Sun River Place
- 7685 Gibralter Dr
- 7614 Safari Cir
- 7605 Safari Cir
- 2905 Zephyr Dr
- 7622 Safari Cir
- 2915 Zephyr Dr
- 7680 Gibralter Dr
- 7720 Chateau Ct
- 7611 Safari Cir
- 7670 Gibralter Dr
- 2865 Zephyr Dr
- 7635 Gibralter Dr
- 7630 Safari Cir
- 7660 Gibralter Dr
- 2925 Zephyr Dr
- 7710 Chateau Ct
- 2855 Zephyr Dr
- 7617 Safari Cir
- 7625 Gibralter Dr
- 7650 Gibralter Dr