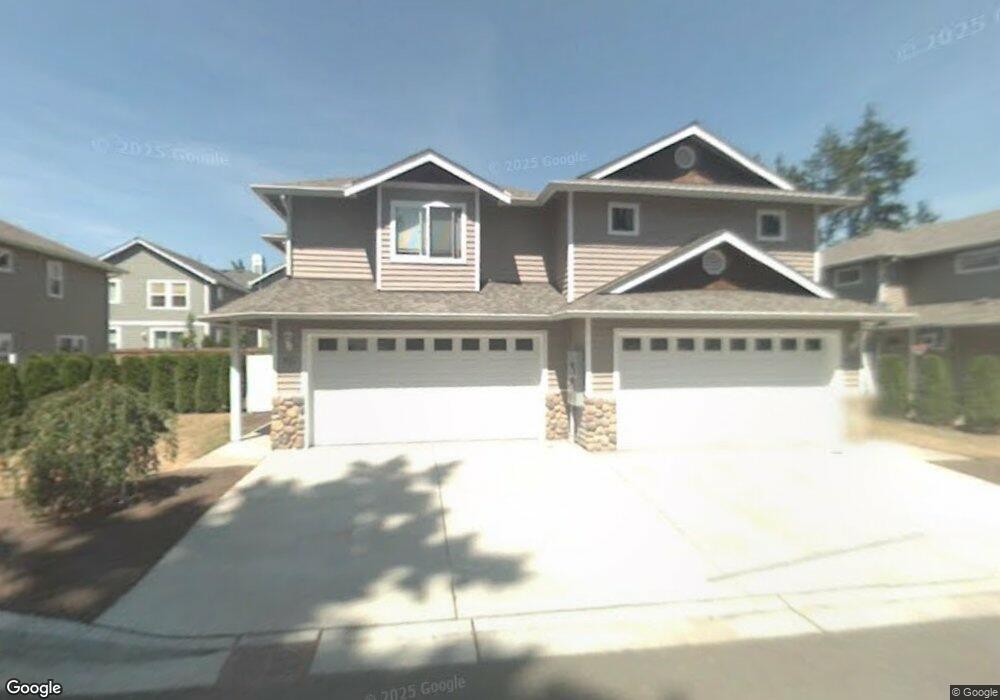
7609 232nd St SW Unit A Edmonds, WA 98026
Esperance NeighborhoodEstimated Value: $523,000 - $654,000
3
Beds
3
Baths
1,288
Sq Ft
$443/Sq Ft
Est. Value
About This Home
This home is located at 7609 232nd St SW Unit A, Edmonds, WA 98026 and is currently estimated at $570,388, approximately $442 per square foot. 7609 232nd St SW Unit A is a home located in Snohomish County with nearby schools including Westgate Elementary School, College Place Middle School, and Edmonds-Woodway High School.
Ownership History
Date
Name
Owned For
Owner Type
Purchase Details
Closed on
Apr 16, 2018
Sold by
Chien Hui Chen
Bought by
Chen Lisa C
Current Estimated Value
Purchase Details
Closed on
Jul 23, 2010
Sold by
Center William D and Center Karla K
Bought by
Chi Nancy and Chi Leon Li Yen
Purchase Details
Closed on
Sep 13, 2005
Sold by
232Nd Street Llc
Bought by
Trahan Robert S and Trahan Kimberly M
Home Financials for this Owner
Home Financials are based on the most recent Mortgage that was taken out on this home.
Original Mortgage
$207,960
Interest Rate
5.87%
Mortgage Type
Fannie Mae Freddie Mac
Purchase Details
Closed on
Aug 16, 2005
Sold by
232Nd Street Llc
Bought by
Center William D and Center Karla K
Home Financials for this Owner
Home Financials are based on the most recent Mortgage that was taken out on this home.
Original Mortgage
$207,960
Interest Rate
5.87%
Mortgage Type
Fannie Mae Freddie Mac
Create a Home Valuation Report for This Property
The Home Valuation Report is an in-depth analysis detailing your home's value as well as a comparison with similar homes in the area
Home Values in the Area
Average Home Value in this Area
Purchase History
| Date | Buyer | Sale Price | Title Company |
|---|---|---|---|
| Chen Lisa C | -- | None Available | |
| Chi Nancy | $245,000 | Commonwealth Land Title | |
| Trahan Robert S | $259,950 | Chicago Title Insurance Co | |
| Center William D | $254,950 | Pnwt |
Source: Public Records
Mortgage History
| Date | Status | Borrower | Loan Amount |
|---|---|---|---|
| Previous Owner | Trahan Robert S | $207,960 | |
| Previous Owner | Center William D | $203,960 |
Source: Public Records
Tax History Compared to Growth
Tax History
| Year | Tax Paid | Tax Assessment Tax Assessment Total Assessment is a certain percentage of the fair market value that is determined by local assessors to be the total taxable value of land and additions on the property. | Land | Improvement |
|---|---|---|---|---|
| 2025 | $2,154 | $556,500 | $127,500 | $429,000 |
| 2024 | $2,154 | $542,000 | $124,000 | $418,000 |
| 2023 | $2,108 | $509,000 | $116,000 | $393,000 |
| 2022 | $2,256 | $435,500 | $98,000 | $337,500 |
| 2020 | $3,088 | $332,000 | $88,500 | $243,500 |
| 2019 | $3,063 | $332,000 | $82,500 | $249,500 |
| 2018 | $3,373 | $316,000 | $60,500 | $255,500 |
| 2017 | $2,874 | $282,000 | $43,500 | $238,500 |
| 2016 | $2,478 | $241,000 | $43,500 | $197,500 |
| 2015 | $2,369 | $217,000 | $43,500 | $173,500 |
| 2013 | $1,885 | $163,000 | $49,000 | $114,000 |
Source: Public Records
Map
Nearby Homes
- 7818 228th St SW Unit 106
- 8017 234th St SW Unit 325
- 8021 234th St SW Unit 210
- 23116 80th Place W
- 22604 78th Ave W
- 23001 Lakeview Dr Unit I103
- 23727 80th Ct W
- 7907 240th St SW
- 7901 240th St SW
- 23509 Lakeview Dr Unit A101
- 23405 Lakeview Dr Unit H306
- 7628 222nd St SW Unit B4
- 7205 224th St SW Unit M6
- 8614 Madrona Ln
- 8012 222nd St SW
- 7914 242nd St SW
- 8615 238th St SW Unit B101
- 8825 231st Place SW
- 22210 222nd St SW
- 8517 242nd St SW Unit 402
- 7609 232nd St SW Unit B
- 7607 232nd St SW Unit B
- 7607 232nd St SW Unit A
- 7611 232nd St SW Unit B
- 7611 232nd St SW Unit A
- 23138 76th Ave W
- 23124 76th Ave W
- 23204 76th Ave W
- 23148 76th Ave W
- 23126 76th Ave W
- 7605 232nd St SW Unit A&B
- 7605 232nd St SW
- 7605 232nd St SW Unit A
- 7605 232nd St SW Unit B
- 23202 76th Ave W
- 23175 77th Place W
- 23207 77th Place W
- 23216 76th Ave W
- 23122 76th Ave W
- 23220 76th Ave W