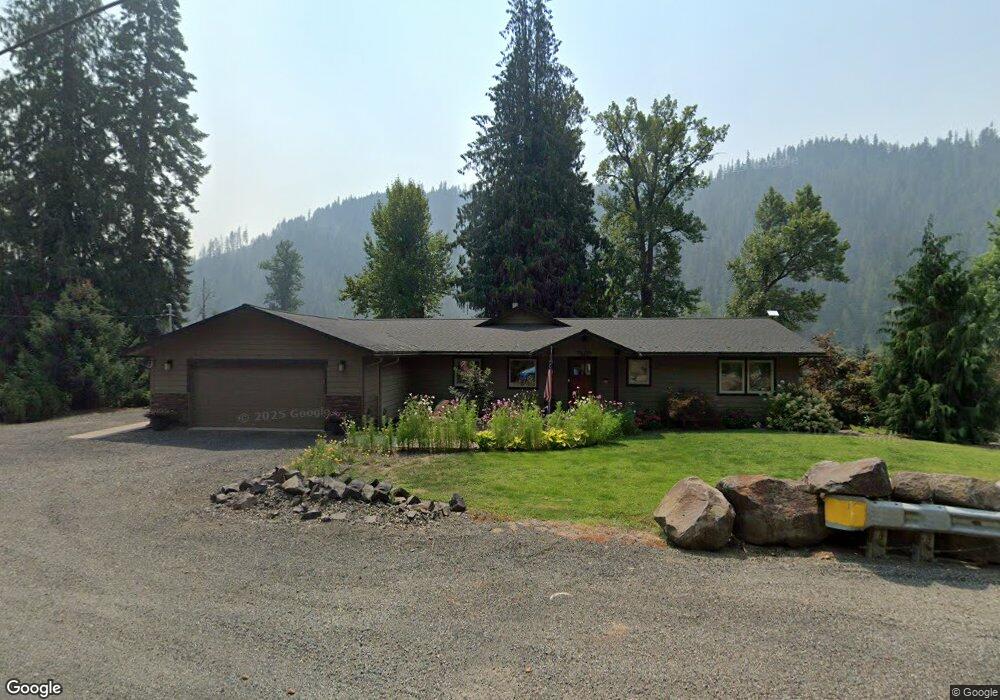
7609 St Joe River Rd Saint Maries, ID 83861
Estimated Value: $1,040,000 - $1,252,000
5
Beds
2
Baths
2,304
Sq Ft
$507/Sq Ft
Est. Value
About This Home
This home is located at 7609 St Joe River Rd, Saint Maries, ID 83861 and is currently estimated at $1,169,018, approximately $507 per square foot. 7609 St Joe River Rd is a home located in Benewah County with nearby schools including Heyburn Elementary School, UpRiver Elementary/Junior High School, and St. Maries Middle School.
Ownership History
Date
Name
Owned For
Owner Type
Purchase Details
Closed on
Sep 9, 2024
Sold by
Anderson Steven R and Anderson Susan
Bought by
Fryer Stefanie and Fryer Matthew
Current Estimated Value
Home Financials for this Owner
Home Financials are based on the most recent Mortgage that was taken out on this home.
Original Mortgage
$400,000
Outstanding Balance
$395,721
Interest Rate
6.73%
Mortgage Type
New Conventional
Estimated Equity
$773,297
Purchase Details
Closed on
Dec 11, 2020
Sold by
Mccarthy Michelle R and Linton Michelle Rae
Bought by
M R P Holdings Llc
Purchase Details
Closed on
Feb 23, 2010
Sold by
Gregory & Cleona Tilley Revocable Trust
Bought by
Mccarthy Russell and Mccarthy Michelle Rae
Home Financials for this Owner
Home Financials are based on the most recent Mortgage that was taken out on this home.
Original Mortgage
$192,000
Interest Rate
5.01%
Mortgage Type
New Conventional
Create a Home Valuation Report for This Property
The Home Valuation Report is an in-depth analysis detailing your home's value as well as a comparison with similar homes in the area
Home Values in the Area
Average Home Value in this Area
Purchase History
| Date | Buyer | Sale Price | Title Company |
|---|---|---|---|
| Fryer Stefanie | -- | Kootenai Title | |
| M R P Holdings Llc | -- | None Available | |
| Mccarthy Russell | -- | -- |
Source: Public Records
Mortgage History
| Date | Status | Borrower | Loan Amount |
|---|---|---|---|
| Open | Fryer Stefanie | $400,000 | |
| Previous Owner | Mccarthy Russell | $192,000 |
Source: Public Records
Tax History Compared to Growth
Tax History
| Year | Tax Paid | Tax Assessment Tax Assessment Total Assessment is a certain percentage of the fair market value that is determined by local assessors to be the total taxable value of land and additions on the property. | Land | Improvement |
|---|---|---|---|---|
| 2025 | $4,257 | $847,260 | $513,200 | $334,060 |
| 2024 | $4,257 | $945,064 | $513,200 | $431,864 |
| 2023 | $4,189 | $898,230 | $513,200 | $385,030 |
| 2022 | $4,978 | $948,018 | $513,200 | $434,818 |
| 2021 | $3,486 | $390,408 | $87,000 | $303,408 |
| 2020 | $3,441 | $361,093 | $74,000 | $287,093 |
| 2019 | $3,429 | $359,522 | $72,000 | $287,522 |
| 2018 | $3,383 | $347,114 | $56,000 | $291,114 |
| 2017 | $3,064 | $280,476 | $46,000 | $234,476 |
| 2016 | $1,730 | $148,852 | $46,000 | $102,852 |
| 2015 | $1,701 | $149,052 | $46,000 | $103,052 |
| 2014 | -- | $149,298 | $46,000 | $103,298 |
| 2013 | -- | $149,298 | $46,000 | $103,298 |
Source: Public Records
Map
Nearby Homes
- 842 W Riverside Dr
- NKA Railroad Grade
- 23 Horn Hooked
- 19 Horn Hooked Ln
- L15 Horn Hooked Estates
- 8644 Railroad Grade
- 484 Ahrs Loop
- 12412 Saint Joe River Rd
- 77 Garden Way
- 74 Garden Way
- 149 Sunny Rd
- 166 Garden Way
- 61 Pine St
- 110 Saint Joe River Park
- 1337 St Joe River Rd
- TBD No Address Per Seller
- NNA First St
- 1119 Elm Dr
- 1827 Saint Joe River Rd
- 6686 Saint Joe River Rd
- 7609 St Joe River Rd
- 7609 Saint Joe River Rd
- 7571 Saint Joe River Rd
- 532 Cedar Grove Ln
- 448 Cedar Grove
- 0 John Creek Road Area
- Lot #1 Cedar Grove
- 394 Cedar Grove Ln
- 294 Cedar Grove Ln
- Lot 13 Finney St Joe Tracts
- 268 Cedar Grove Ln
- Lot 14 Finney St Joe Tracts
- 284 Cedar Grove Ln
- 250 Cedar Grove Ln
- 276 Cedar Grove Ln
- Lot 11 Finney St Joe Tracts
- Lot 17 Finney St Joe Tracts
- Lot 12 Finney St Joe Tracts
- Lot 10 Finney St Joe Tracts
- 230 Cedar Grove Ln