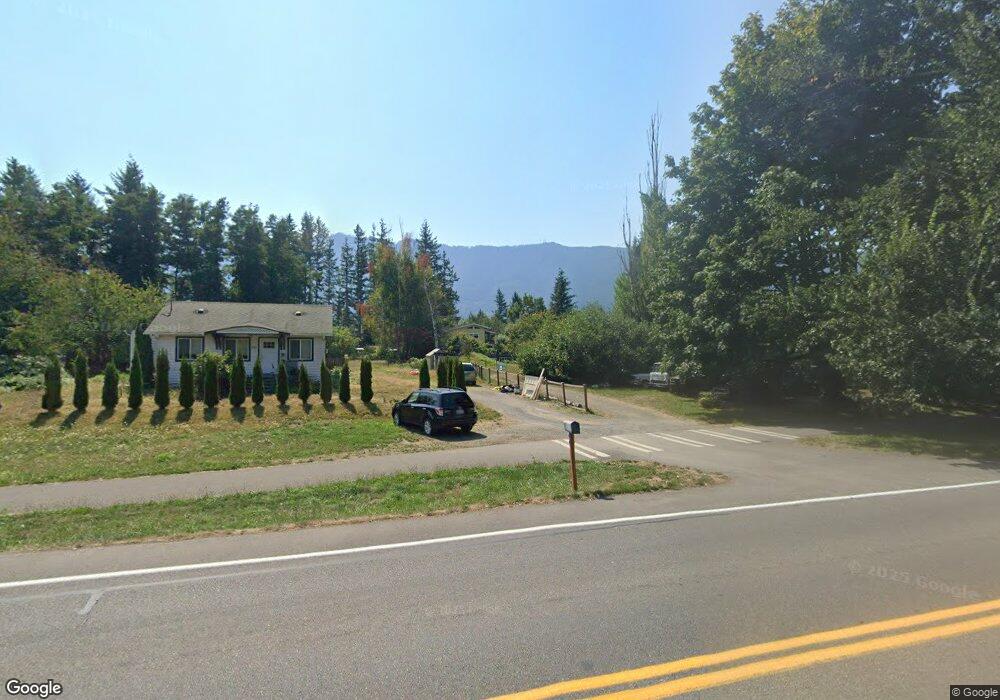
761 E North Bend Way North Bend, WA 98045
Estimated Value: $644,596 - $704,000
3
Beds
1
Bath
1,570
Sq Ft
$425/Sq Ft
Est. Value
About This Home
This home is located at 761 E North Bend Way, North Bend, WA 98045 and is currently estimated at $667,532, approximately $425 per square foot. 761 E North Bend Way is a home located in King County with nearby schools including North Bend Elementary School, Twin Falls Middle School, and Mount Si High School.
Ownership History
Date
Name
Owned For
Owner Type
Purchase Details
Closed on
Sep 15, 2025
Sold by
Johnson Debra K
Bought by
Debra Kay Johnson Living Trust and Johnson
Current Estimated Value
Purchase Details
Closed on
Jun 8, 2018
Sold by
Cox Ross
Bought by
Johnson Debra K
Purchase Details
Closed on
Nov 14, 2013
Sold by
Wilderness33 Llc
Bought by
Hanifan John R and Hanifan Beth A
Purchase Details
Closed on
Sep 20, 2013
Sold by
Orr Rocky Eugene
Bought by
Johnson Debra K and Orr Debra K Johnson
Purchase Details
Closed on
May 14, 2004
Sold by
Johnson Orr Debra K and Johnson Debra K
Bought by
Orr Rocky E and Johnson Orr Debra K
Home Financials for this Owner
Home Financials are based on the most recent Mortgage that was taken out on this home.
Original Mortgage
$252,000
Interest Rate
6.75%
Purchase Details
Closed on
Nov 20, 1992
Sold by
Johnson Debra
Bought by
Johnson Debra K
Create a Home Valuation Report for This Property
The Home Valuation Report is an in-depth analysis detailing your home's value as well as a comparison with similar homes in the area
Home Values in the Area
Average Home Value in this Area
Purchase History
| Date | Buyer | Sale Price | Title Company |
|---|---|---|---|
| Johnson Debra K | $125,000 | None Available | |
| Hanifan John R | -- | None Available | |
| Johnson Debra K | -- | None Available | |
| Orr Rocky E | -- | Pacific Nw Tit | |
| Johnson Debra K | -- | -- |
Source: Public Records
Mortgage History
| Date | Status | Borrower | Loan Amount |
|---|---|---|---|
| Previous Owner | Orr Rocky E | $252,000 |
Source: Public Records
Tax History Compared to Growth
Tax History
| Year | Tax Paid | Tax Assessment Tax Assessment Total Assessment is a certain percentage of the fair market value that is determined by local assessors to be the total taxable value of land and additions on the property. | Land | Improvement |
|---|---|---|---|---|
| 2024 | $659 | $580,400 | $283,400 | $297,000 |
| 2023 | $688 | $514,400 | $257,400 | $257,000 |
| 2022 | $748 | $566,700 | $294,700 | $272,000 |
| 2021 | $771 | $442,000 | $224,000 | $218,000 |
| 2020 | $6,340 | $466,000 | $283,000 | $183,000 |
| 2018 | $3,783 | $492,600 | $369,600 | $123,000 |
| 2017 | $2,938 | $306,000 | $186,000 | $120,000 |
| 2016 | $2,938 | $259,000 | $164,000 | $95,000 |
| 2015 | $2,648 | $234,000 | $146,000 | $88,000 |
| 2014 | -- | $228,000 | $143,000 | $85,000 |
| 2013 | -- | $239,000 | $117,000 | $122,000 |
Source: Public Records
Map
Nearby Homes
- 369 E Park St Unit D3
- 1094 SE 10th St
- 751 SE 11th St
- 690 SE 11th Place
- 690 SE 11th Place Unit 8
- 639 11th Place
- Martin Plan at Harrison Court
- Savannah Plan at Harrison Court
- Caslon Plan at Harrison Court
- Legacy Plan at Harrison Court
- Bridgewater Plan at Harrison Court
- Stafford Plan at Harrison Court
- 716 SE 11th Place
- 716 SE 11th Place Unit 7
- 1118 Swiftwater Way SE Unit Lot 35
- 1117 Swiftwater Way SE
- 1117 Swiftwater Way SE Unit 42
- 639 SE 11th Place Unit 55
- 1146 Swiftwater Way SE Unit LOT 33
- 1131 Swiftwater Way SE Unit 43
- 721 E North Bend Way
- 791 E North Bend Way
- 728 SE Cedar Falls Way
- 784 E North Bend Way
- 681 E North Bend Way
- 790 E North Bend Way
- 851 E North Bend Way
- 121 Thrasher Ave NE
- 137 424th Ave SE
- 121 424th Ave SE
- 735 SE Cedar Falls Way
- 42121 E North Bend Way
- 640 SE 5th St
- 129 Thrasher Ave NE
- 79 xxx E North Bend Way
- 78 xxx E North Bend Way
- 330 E North Bend Way
- 600 SE 5th St
- 485 Maloney Grove Ave SE