761 Grant Rd Cataula, GA 31804
Cataula NeighborhoodEstimated Value: $191,000 - $256,000
3
Beds
2
Baths
1,385
Sq Ft
$164/Sq Ft
Est. Value
About This Home
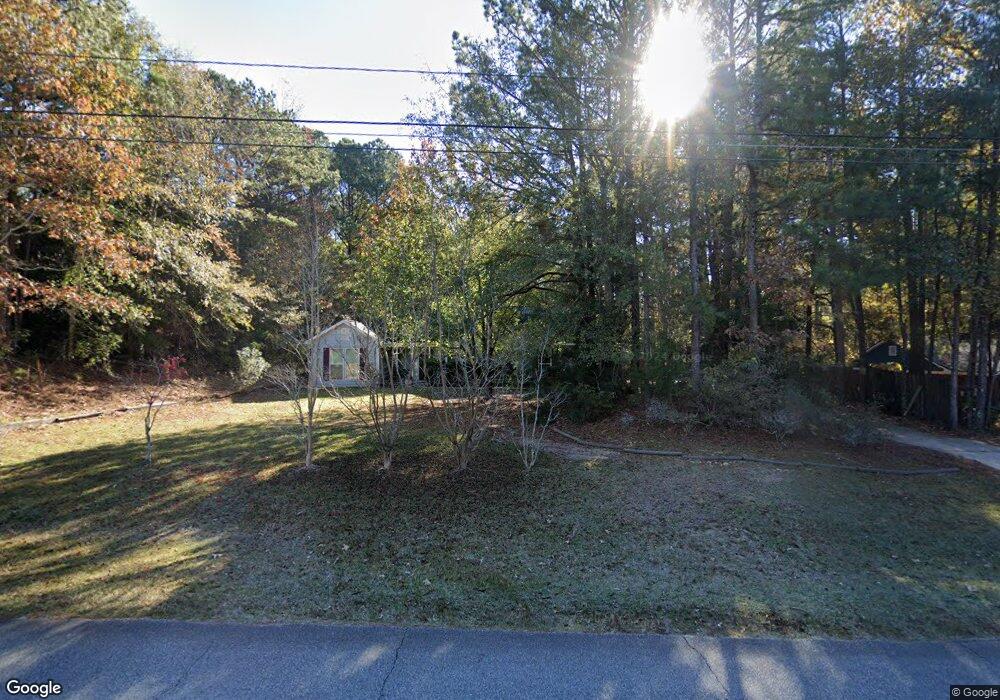
This home is located at 761 Grant Rd, Cataula, GA 31804 and is currently estimated at $226,740, approximately $163 per square foot. 761 Grant Rd is a home located in Harris County with nearby schools including Mulberry Creek Elementary School, Creekside School, and Harris County Carver Middle School.
Ownership History
Date
Name
Owned For
Owner Type
Purchase Details
Closed on
Jan 21, 2011
Sold by
Homesales Inc
Bought by
Pesante Eduardo J
Current Estimated Value
Home Financials for this Owner
Home Financials are based on the most recent Mortgage that was taken out on this home.
Original Mortgage
$93,264
Outstanding Balance
$63,144
Interest Rate
4.79%
Mortgage Type
New Conventional
Estimated Equity
$163,596
Purchase Details
Closed on
Sep 28, 2010
Sold by
Chase Home Finance Llc
Bought by
Homesales Inc
Purchase Details
Closed on
Jul 6, 2010
Sold by
Brewer Corey A
Bought by
Chase Home Finance Llc
Purchase Details
Closed on
Sep 17, 2008
Sold by
Lehman Brian Aj
Bought by
Brewer Corey A
Home Financials for this Owner
Home Financials are based on the most recent Mortgage that was taken out on this home.
Original Mortgage
$126,632
Interest Rate
6.45%
Mortgage Type
New Conventional
Purchase Details
Closed on
Apr 1, 1996
Bought by
Lehman Brian A J and Relfo Patricia D
Create a Home Valuation Report for This Property
The Home Valuation Report is an in-depth analysis detailing your home's value as well as a comparison with similar homes in the area
Home Values in the Area
Average Home Value in this Area
Purchase History
| Date | Buyer | Sale Price | Title Company |
|---|---|---|---|
| Pesante Eduardo J | $90,000 | -- | |
| Homesales Inc | -- | -- | |
| Chase Home Finance Llc | $110,500 | -- | |
| Brewer Corey A | $124,400 | -- | |
| Lehman Brian A J | $79,900 | -- |
Source: Public Records
Mortgage History
| Date | Status | Borrower | Loan Amount |
|---|---|---|---|
| Open | Pesante Eduardo J | $93,264 | |
| Previous Owner | Brewer Corey A | $126,632 |
Source: Public Records
Tax History
| Year | Tax Paid | Tax Assessment Tax Assessment Total Assessment is a certain percentage of the fair market value that is determined by local assessors to be the total taxable value of land and additions on the property. | Land | Improvement |
|---|---|---|---|---|
| 2025 | $2,262 | $73,805 | $12,000 | $61,805 |
| 2024 | $1,933 | $67,007 | $12,000 | $55,007 |
| 2023 | $1,661 | $56,767 | $12,000 | $44,767 |
| 2022 | $1,661 | $56,767 | $12,000 | $44,767 |
| 2021 | $1,535 | $50,158 | $12,000 | $38,158 |
| 2020 | $1,535 | $50,158 | $12,000 | $38,158 |
| 2019 | $1,392 | $46,647 | $12,000 | $34,647 |
| 2018 | $1,417 | $46,647 | $12,000 | $34,647 |
| 2017 | $1,298 | $42,240 | $12,000 | $30,240 |
| 2016 | $1,153 | $40,654 | $12,000 | $28,654 |
| 2015 | $1,155 | $40,654 | $12,000 | $28,654 |
| 2014 | $1,157 | $40,654 | $12,000 | $28,654 |
| 2013 | -- | $40,653 | $12,000 | $28,653 |
Source: Public Records
Map
Nearby Homes
- 476 Wildwood Plantation Dr
- 909 Red Fox Ct
- Lot 81 Woodland Dr
- 4490 Ga Hwy 259
- 169 Cotton Ln
- 492 Mulberry Crossing Dr
- 141 Voorhees Rd
- 111 Shadewood Dr
- 139 Shadewood Dr
- 8600 Ga Highway 315
- 1268 Georgia 208
- 1578 Ga Highway 208
- 776 Grey Smoke Loop
- 0 Kennon Dr Unit 1
- 385 Hudson Mill Cir
- 0 Ga Highway 27 Unit 231195
- 0 Walker Rd
- 2074 Calhoun Rd
- 303 Waterford Dr
- 509 Sweetwater Dr
Your Personal Tour Guide
Ask me questions while you tour the home.