761 Ketill Trace Winfield, IN 46307
Porter County NeighborhoodEstimated Value: $530,000 - $669,275
4
Beds
4
Baths
3,796
Sq Ft
$158/Sq Ft
Est. Value
About This Home
This home is located at 761 Ketill Trace, Winfield, IN 46307 and is currently estimated at $598,069, approximately $157 per square foot. 761 Ketill Trace is a home located in Porter County with nearby schools including Porter Lakes Elementary School, Boone Grove Elementary School, and Boone Grove Middle School.
Ownership History
Date
Name
Owned For
Owner Type
Purchase Details
Closed on
Jan 17, 2020
Sold by
Spk Construction Llc
Bought by
Kilby Keith E and Kilby Nicolette Iolani
Current Estimated Value
Home Financials for this Owner
Home Financials are based on the most recent Mortgage that was taken out on this home.
Original Mortgage
$468,000
Outstanding Balance
$414,529
Interest Rate
3.73%
Mortgage Type
New Conventional
Estimated Equity
$183,540
Purchase Details
Closed on
Dec 28, 2018
Sold by
Kilby Keith E and Kilby Nicolette Lolani
Bought by
Spk Construction Llc
Purchase Details
Closed on
Oct 12, 2018
Sold by
Fwa Development Llc
Bought by
Kilby Keith E and Kilby Nicolette Iolani
Create a Home Valuation Report for This Property
The Home Valuation Report is an in-depth analysis detailing your home's value as well as a comparison with similar homes in the area
Home Values in the Area
Average Home Value in this Area
Purchase History
| Date | Buyer | Sale Price | Title Company |
|---|---|---|---|
| Kilby Keith E | $597,477 | Chicago Title Company Llc | |
| Spk Construction Llc | -- | None Available | |
| Kilby Keith E | -- | Meridian Title Co |
Source: Public Records
Mortgage History
| Date | Status | Borrower | Loan Amount |
|---|---|---|---|
| Open | Kilby Keith E | $468,000 |
Source: Public Records
Tax History Compared to Growth
Tax History
| Year | Tax Paid | Tax Assessment Tax Assessment Total Assessment is a certain percentage of the fair market value that is determined by local assessors to be the total taxable value of land and additions on the property. | Land | Improvement |
|---|---|---|---|---|
| 2024 | $5,101 | $638,700 | $77,000 | $561,700 |
| 2023 | $4,741 | $635,100 | $77,000 | $558,100 |
| 2022 | $4,514 | $543,900 | $44,600 | $499,300 |
| 2021 | $3,961 | $449,200 | $44,600 | $404,600 |
| 2020 | $3,320 | $405,400 | $40,600 | $364,800 |
| 2019 | $851 | $40,600 | $40,600 | $0 |
| 2018 | $211 | $700 | $700 | $0 |
| 2017 | $212 | $800 | $800 | $0 |
| 2016 | $213 | $900 | $900 | $0 |
| 2014 | $2,221 | $900 | $900 | $0 |
| 2013 | -- | $800 | $800 | $0 |
Source: Public Records
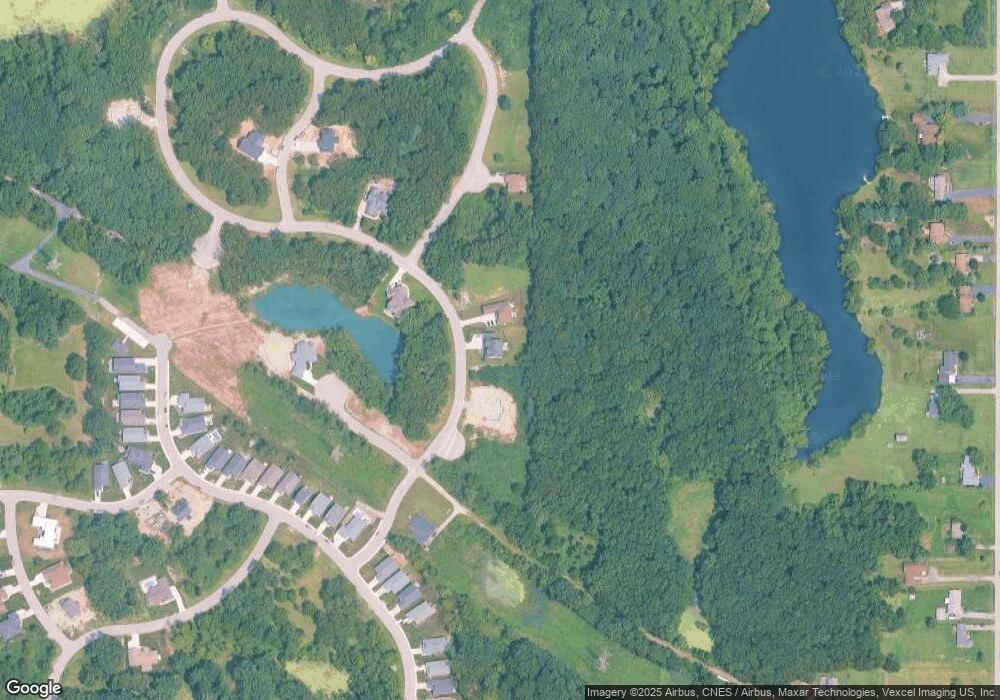
Map
Nearby Homes
- 763 Ketill Trace
- 767 Ketill Trace
- 764 Ketill Trace
- 732 Ketill Trace
- 700 W Bay Ct
- 91 Eskir Ln
- 702 W Bay Ct
- 710, 712, & 714 Ketill Trace
- 746 Ketill Trail
- 753 Ketill Trace
- 744 Ketill Ct
- 747 Ketill Trail
- 740 & 742 Verdano Terrace
- 736 & 738 Verdano Terrace
- 732 & 734 Verdano Terrace
- 84 Eskir Ln
- 31 Davidano Ct
- 709 Ketill Trail
- 718 Verdano Terrace
- 707 Ketill Trail
- 761 Ketill Trace
- 761 Ketill Trail
- 763 Ketill Trail
- 759 Ketill Trace
- 759 Ketill Trace
- 759 Ketill Trail
- 765 Ketill Trail
- 765 Ketill Trace
- 757 Ketill Trace
- 760 Ketill Trace
- 760 Ketill Trail
- 767 Ketill Trail
- 764 Ketill Trail
- 754 Ketill Trail
- 754 Ketill Trace
- 769 Ketill Trail
- 752 Ketill Trail
- 771 Ketill Trace
- 771 Ketill Trail
- 750 Ketill Trail