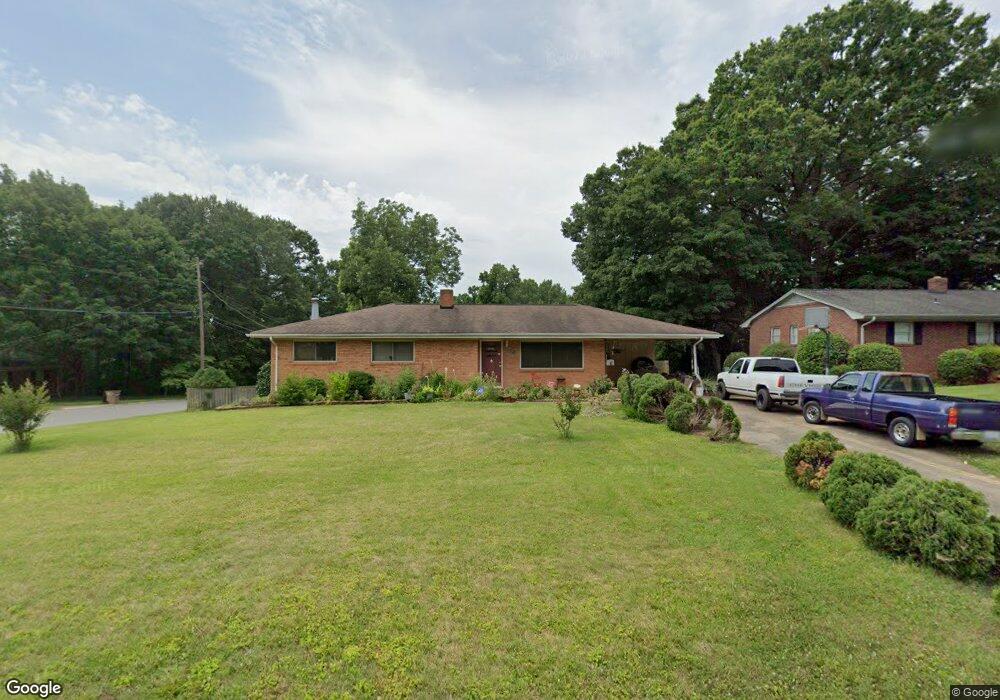
761 Lowery St Shelby, NC 28152
Estimated Value: $193,000 - $234,000
--
Bed
--
Bath
1,344
Sq Ft
$164/Sq Ft
Est. Value
About This Home
This home is located at 761 Lowery St, Shelby, NC 28152 and is currently estimated at $220,760, approximately $164 per square foot. 761 Lowery St is a home located in Cleveland County with nearby schools including Graham Elementary School, James Love Elementary School, and Shelby Middle School.
Ownership History
Date
Name
Owned For
Owner Type
Purchase Details
Closed on
Aug 8, 2007
Sold by
Lasalle Bank National Asso
Bought by
Superior Bank Fsb
Current Estimated Value
Home Financials for this Owner
Home Financials are based on the most recent Mortgage that was taken out on this home.
Original Mortgage
$570,887
Interest Rate
6.41%
Mortgage Type
FHA
Purchase Details
Closed on
Jan 2, 2007
Sold by
Hill Robert E and Hill Brenda
Bought by
Lasalle Bank National Assn and Lasalle National Bank
Create a Home Valuation Report for This Property
The Home Valuation Report is an in-depth analysis detailing your home's value as well as a comparison with similar homes in the area
Home Values in the Area
Average Home Value in this Area
Purchase History
| Date | Buyer | Sale Price | Title Company |
|---|---|---|---|
| Superior Bank Fsb | $72,000 | None Available | |
| Lasalle Bank National Assn | $68,000 | None Available |
Source: Public Records
Mortgage History
| Date | Status | Borrower | Loan Amount |
|---|---|---|---|
| Previous Owner | Superior Bank Fsb | $570,887 |
Source: Public Records
Tax History Compared to Growth
Tax History
| Year | Tax Paid | Tax Assessment Tax Assessment Total Assessment is a certain percentage of the fair market value that is determined by local assessors to be the total taxable value of land and additions on the property. | Land | Improvement |
|---|---|---|---|---|
| 2025 | $1,430 | $143,677 | $15,897 | $127,780 |
| 2024 | $1,124 | $91,208 | $11,923 | $79,285 |
| 2023 | $1,118 | $91,208 | $11,923 | $79,285 |
| 2022 | $1,118 | $91,208 | $11,923 | $79,285 |
| 2021 | $1,124 | $91,208 | $11,923 | $79,285 |
| 2020 | $836 | $65,533 | $9,936 | $55,597 |
| 2019 | $836 | $65,533 | $9,936 | $55,597 |
| 2018 | $835 | $65,533 | $9,936 | $55,597 |
| 2017 | $814 | $65,533 | $9,936 | $55,597 |
| 2016 | $816 | $65,533 | $9,936 | $55,597 |
| 2015 | $1,141 | $97,148 | $10,929 | $86,219 |
| 2014 | $1,141 | $97,148 | $10,929 | $86,219 |
Source: Public Records
Map
Nearby Homes