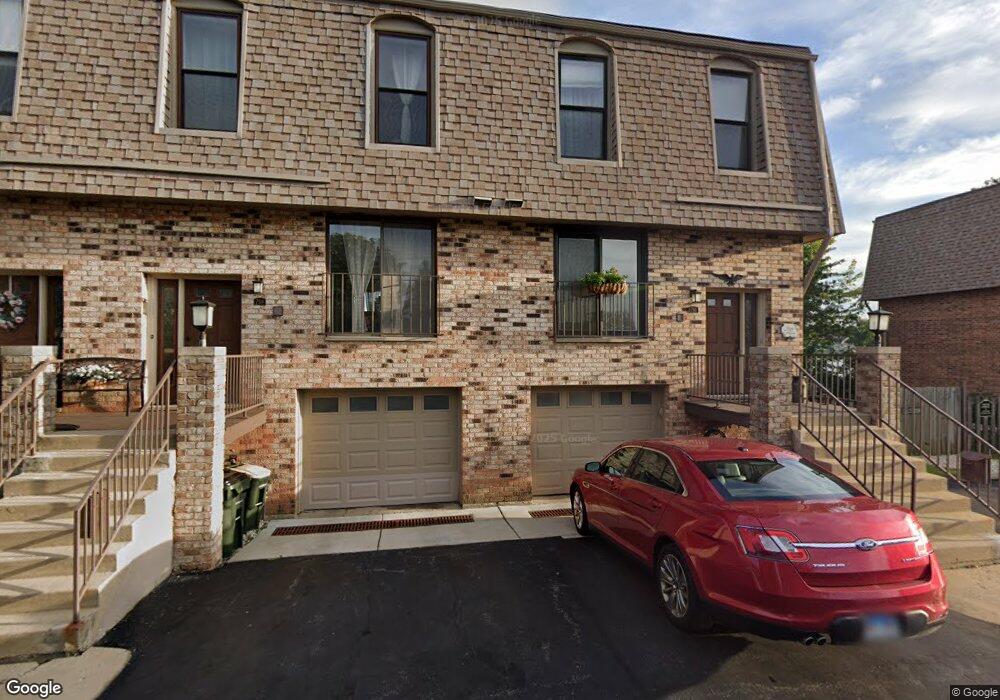
761 N Old Rand Rd Unit 6 Lake Zurich, IL 60047
Estimated Value: $299,000 - $496,000
--
Bed
3
Baths
1,400
Sq Ft
$293/Sq Ft
Est. Value
About This Home
This home is located at 761 N Old Rand Rd Unit 6, Lake Zurich, IL 60047 and is currently estimated at $410,325, approximately $293 per square foot. 761 N Old Rand Rd Unit 6 is a home located in Lake County with nearby schools including May Whitney Elementary School, Lake Zurich Middle School North, and Lake Zurich High School.
Ownership History
Date
Name
Owned For
Owner Type
Purchase Details
Closed on
Sep 25, 2013
Sold by
Ladisa Barbara J
Bought by
Gargano Philip and Gargano Kathleen K
Current Estimated Value
Home Financials for this Owner
Home Financials are based on the most recent Mortgage that was taken out on this home.
Original Mortgage
$186,000
Outstanding Balance
$49,274
Interest Rate
4.58%
Mortgage Type
New Conventional
Estimated Equity
$361,051
Purchase Details
Closed on
May 1, 2001
Sold by
Brainerd Frank J
Bought by
Ladisa Barbara J
Home Financials for this Owner
Home Financials are based on the most recent Mortgage that was taken out on this home.
Original Mortgage
$120,000
Interest Rate
7.2%
Mortgage Type
Stand Alone First
Purchase Details
Closed on
Aug 15, 2000
Sold by
Brainerd Frank J and Brainerd Dorothy N
Bought by
Brainerd Frank J and The Frank J Brainerd Self Declaration Tr
Create a Home Valuation Report for This Property
The Home Valuation Report is an in-depth analysis detailing your home's value as well as a comparison with similar homes in the area
Home Values in the Area
Average Home Value in this Area
Purchase History
| Date | Buyer | Sale Price | Title Company |
|---|---|---|---|
| Gargano Philip | $273,000 | None Available | |
| Ladisa Barbara J | $220,000 | -- | |
| Brainerd Frank J | -- | -- |
Source: Public Records
Mortgage History
| Date | Status | Borrower | Loan Amount |
|---|---|---|---|
| Open | Gargano Philip | $186,000 | |
| Previous Owner | Ladisa Barbara J | $120,000 |
Source: Public Records
Tax History Compared to Growth
Tax History
| Year | Tax Paid | Tax Assessment Tax Assessment Total Assessment is a certain percentage of the fair market value that is determined by local assessors to be the total taxable value of land and additions on the property. | Land | Improvement |
|---|---|---|---|---|
| 2024 | $8,045 | $113,306 | $19,967 | $93,339 |
| 2023 | $7,567 | $110,263 | $19,431 | $90,832 |
| 2022 | $7,567 | $102,052 | $19,055 | $82,997 |
| 2021 | $7,302 | $99,437 | $18,567 | $80,870 |
| 2020 | $7,170 | $99,437 | $18,567 | $80,870 |
| 2019 | $7,061 | $98,570 | $18,405 | $80,165 |
| 2018 | $6,108 | $86,366 | $19,799 | $66,567 |
| 2017 | $6,065 | $85,325 | $19,560 | $65,765 |
| 2016 | $6,722 | $92,705 | $18,941 | $73,764 |
| 2015 | $6,620 | $88,299 | $18,041 | $70,258 |
| 2014 | $6,742 | $88,868 | $19,541 | $69,327 |
| 2012 | $6,289 | $89,055 | $19,582 | $69,473 |
Source: Public Records
Map
Nearby Homes
- 900 Winnetka Terrace
- 195 Clover Hill Ln
- 1028 Aspen Ct
- 68 Beech Dr
- 1073 Poplar Ct
- 14 Beech Dr
- 62 Miller Rd
- 64 Miller Rd
- 0 Manchester Rd Unit MRD12503617
- 185 Kimberly Rd
- 54 Mionske Dr
- 77 Mionske Dr
- 27 Maple Ave
- 10 Pine Ave
- 155 Canterbury Way
- 890 June Terrace Unit 140
- 15 S Wynstone Dr
- 205 Orchard Rd Unit 1
- 170 N Rainbow Rd
- 226 Biltmore Dr
- 759 N Old Rand Rd Unit 5
- 757 N Old Rand Rd Unit 4
- 755 N Old Rand Rd Unit 3
- 753 N Old Rand Rd Unit 2
- 751 N Old Rand Rd
- 779 N Old Rand Rd Unit 1
- 743 N Old Rand Rd Unit 6
- 781 N Old Rand Rd
- 741 N Old Rand Rd Unit 5
- 783 N Old Rand Rd
- 739 N Old Rand Rd Unit 4
- 785 N Old Rand Rd Unit 4
- 737 N Old Rand Rd
- 787 N Old Rand Rd
- 4 Lakebreeze Ct
- 735 N Old Rand Rd Unit 2
- 789 N Old Rand Rd Unit 6
- 789 N Old Rand Rd
- 733 N Old Rand Rd Unit 1
- 6 Lakebreeze Ct