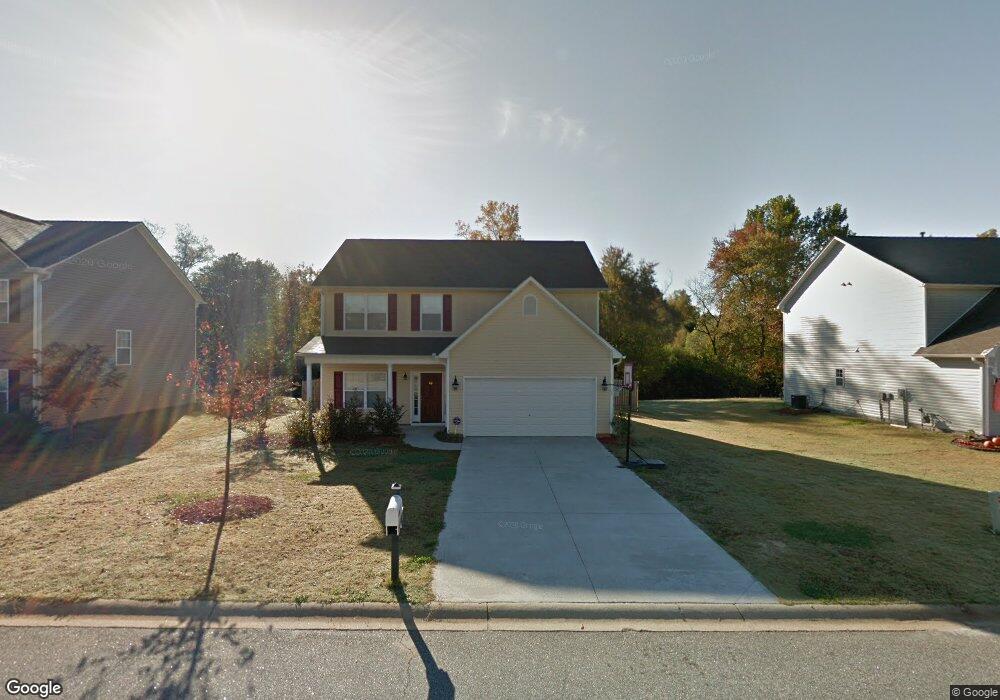
761 Shadow Dance Ln Boiling Springs, SC 29316
Estimated Value: $262,000 - $294,000
3
Beds
3
Baths
1,997
Sq Ft
$141/Sq Ft
Est. Value
About This Home
This home is located at 761 Shadow Dance Ln, Boiling Springs, SC 29316 and is currently estimated at $281,863, approximately $141 per square foot. 761 Shadow Dance Ln is a home located in Spartanburg County with nearby schools including Boiling Springs Middle School, Boiling Springs High School, and High Point Academy.
Ownership History
Date
Name
Owned For
Owner Type
Purchase Details
Closed on
Jun 13, 2024
Sold by
Keenon Terri L and Keenon Kendrick
Bought by
Drummond Keenon Terri
Current Estimated Value
Home Financials for this Owner
Home Financials are based on the most recent Mortgage that was taken out on this home.
Original Mortgage
$95,500
Outstanding Balance
$94,298
Interest Rate
7.09%
Mortgage Type
New Conventional
Estimated Equity
$187,565
Purchase Details
Closed on
Sep 30, 2009
Sold by
Lennar Carolinas Llc
Bought by
Keenon Terri L and Keenon Kendrick
Home Financials for this Owner
Home Financials are based on the most recent Mortgage that was taken out on this home.
Original Mortgage
$124,479
Interest Rate
5.05%
Mortgage Type
Future Advance Clause Open End Mortgage
Purchase Details
Closed on
Jul 21, 2005
Sold by
Lennar Carolina Llc
Bought by
Lennar Carolinas Llc
Create a Home Valuation Report for This Property
The Home Valuation Report is an in-depth analysis detailing your home's value as well as a comparison with similar homes in the area
Home Values in the Area
Average Home Value in this Area
Purchase History
| Date | Buyer | Sale Price | Title Company |
|---|---|---|---|
| Drummond Keenon Terri | -- | None Listed On Document | |
| Keenon Terri L | $121,990 | -- | |
| Lennar Carolinas Llc | -- | -- |
Source: Public Records
Mortgage History
| Date | Status | Borrower | Loan Amount |
|---|---|---|---|
| Open | Drummond Keenon Terri | $95,500 | |
| Previous Owner | Keenon Terri L | $124,479 |
Source: Public Records
Tax History Compared to Growth
Tax History
| Year | Tax Paid | Tax Assessment Tax Assessment Total Assessment is a certain percentage of the fair market value that is determined by local assessors to be the total taxable value of land and additions on the property. | Land | Improvement |
|---|---|---|---|---|
| 2025 | $1,191 | $6,490 | $822 | $5,668 |
| 2024 | $1,191 | $6,490 | $822 | $5,668 |
| 2023 | $1,191 | $6,490 | $822 | $5,668 |
| 2022 | $1,066 | $5,644 | $661 | $4,983 |
| 2021 | $1,066 | $5,644 | $661 | $4,983 |
| 2020 | $1,047 | $5,644 | $661 | $4,983 |
| 2019 | $1,047 | $5,644 | $661 | $4,983 |
| 2018 | $1,025 | $5,644 | $661 | $4,983 |
| 2017 | $906 | $4,908 | $720 | $4,188 |
| 2016 | $906 | $4,908 | $720 | $4,188 |
| 2015 | $894 | $4,908 | $720 | $4,188 |
| 2014 | $889 | $4,908 | $720 | $4,188 |
Source: Public Records
Map
Nearby Homes
- 156 Hunter Ridge Dr
- 921 E Emerald Springs Dr
- 2031 Evergreen Dr
- 522 Hemlock Dr
- 238 River Forest Dr
- 9 Willow Pines Ct
- 0 Woodshire Dr Unit 316794
- 108 Woodshire Dr
- 210 Oakmont Dr
- 725 Cotton Branch Dr
- 2274 Hemming Way
- 559 Falls Cottage Run
- 3038 Elmhurst Dr
- 100 Clary Dr
- 117 Hendrix Dr
- 2325 Caffry Ln
- 112 Wells Dr
- 144 Hunter Ridge Dr
- Wisteria II Plan at Lynbrook
- Bradley II Plan at Lynbrook
- 757 Shadow Dance Ln
- 765 Shadow Dance Ln
- 753 Shadow Dance Ln
- 769 Shadow Dance Ln
- 207 Rachel Evans Dr
- 208 Rachel Evans Dr
- 749 Shadow Dance Ln
- 773 Shadow Dance Ln
- 211 Rachel Evans Dr
- 359 Old John Dodd Rd
- 752 Shadow Dance Ln
- 214 Rachel Evans Dr
- 745 Shadow Dance Ln
- 215 Rachel Evans Dr
- 744 Shadow Dance Ln
- 218 Rachel Evans Dr
- 741 Shadow Dance Ln
- 763 Tinder Box Ct
- 347 Old John Dodd Rd
- 219 Rachel Evans Dr