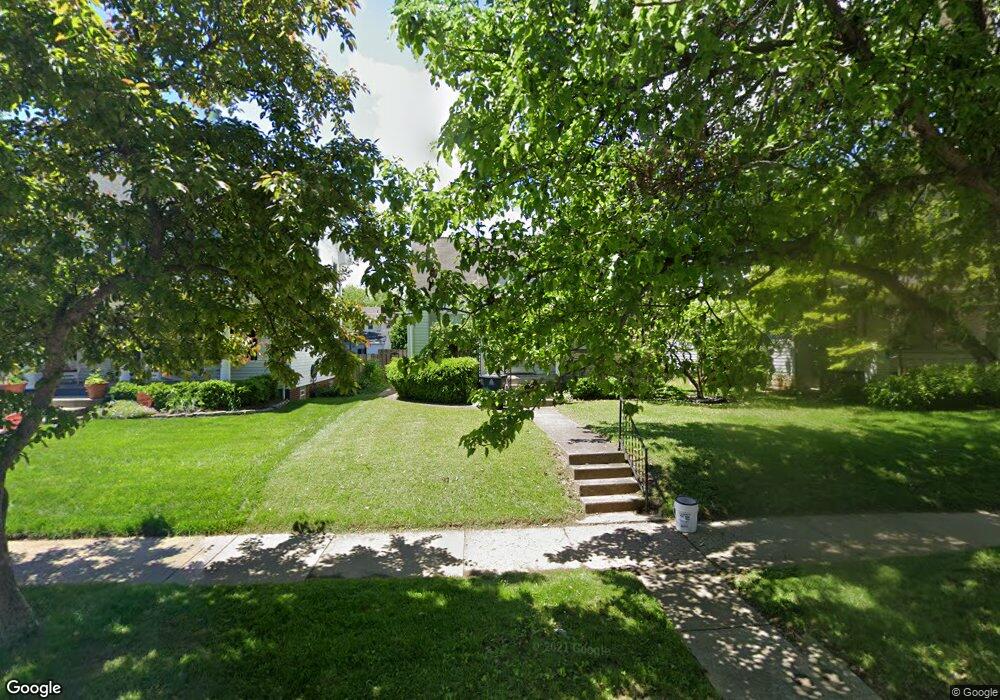
761 Vernon Rd Columbus, OH 43209
Estimated Value: $419,000 - $466,000
3
Beds
2
Baths
1,580
Sq Ft
$278/Sq Ft
Est. Value
About This Home
This home is located at 761 Vernon Rd, Columbus, OH 43209 and is currently estimated at $439,420, approximately $278 per square foot. 761 Vernon Rd is a home located in Franklin County with nearby schools including Montrose Elementary School, Bexley Middle School, and Bexley High School.
Ownership History
Date
Name
Owned For
Owner Type
Purchase Details
Closed on
Oct 31, 2007
Sold by
Evans Robert P and Evans Kathleen S
Bought by
Armentrout Loretta L
Current Estimated Value
Home Financials for this Owner
Home Financials are based on the most recent Mortgage that was taken out on this home.
Original Mortgage
$155,920
Outstanding Balance
$99,008
Interest Rate
6.45%
Mortgage Type
Purchase Money Mortgage
Estimated Equity
$340,412
Purchase Details
Closed on
Oct 3, 2005
Sold by
Warren Stephen R and Warren Diane S
Bought by
Warren Diane S and 762 Vernon Avenue Trust
Purchase Details
Closed on
Jul 16, 2001
Sold by
Jane Daugherty Mary J and Jane Mary
Bought by
Evans Robert P and Evans Kathleen S
Home Financials for this Owner
Home Financials are based on the most recent Mortgage that was taken out on this home.
Original Mortgage
$127,300
Interest Rate
7.16%
Mortgage Type
Purchase Money Mortgage
Purchase Details
Closed on
Dec 2, 1975
Bought by
Daugherty Mary J
Create a Home Valuation Report for This Property
The Home Valuation Report is an in-depth analysis detailing your home's value as well as a comparison with similar homes in the area
Home Values in the Area
Average Home Value in this Area
Purchase History
| Date | Buyer | Sale Price | Title Company |
|---|---|---|---|
| Armentrout Loretta L | $194,900 | Hummel Titl | |
| Warren Diane S | -- | -- | |
| Evans Robert P | $134,000 | -- | |
| Daugherty Mary J | -- | -- |
Source: Public Records
Mortgage History
| Date | Status | Borrower | Loan Amount |
|---|---|---|---|
| Open | Armentrout Loretta L | $155,920 | |
| Previous Owner | Evans Robert P | $127,300 |
Source: Public Records
Tax History Compared to Growth
Tax History
| Year | Tax Paid | Tax Assessment Tax Assessment Total Assessment is a certain percentage of the fair market value that is determined by local assessors to be the total taxable value of land and additions on the property. | Land | Improvement |
|---|---|---|---|---|
| 2024 | $6,257 | $112,670 | $41,340 | $71,330 |
| 2023 | $5,625 | $112,665 | $41,335 | $71,330 |
| 2022 | $8,100 | $86,840 | $20,020 | $66,820 |
| 2021 | $5,403 | $86,840 | $20,020 | $66,820 |
| 2020 | $5,355 | $86,840 | $20,020 | $66,820 |
| 2019 | $5,145 | $73,400 | $16,700 | $56,700 |
| 2018 | $4,332 | $73,400 | $16,700 | $56,700 |
| 2017 | $4,363 | $73,400 | $16,700 | $56,700 |
| 2016 | $4,182 | $64,300 | $15,400 | $48,900 |
| 2015 | $4,195 | $64,300 | $15,400 | $48,900 |
| 2014 | $4,219 | $64,300 | $15,400 | $48,900 |
| 2013 | $2,088 | $61,215 | $14,665 | $46,550 |
Source: Public Records
Map
Nearby Homes
- 696 Vernon Rd
- 789 Chelsea Ave
- 891 Vernon Rd
- 905 Vernon Rd
- 843 Kenwick Rd
- 1000 S Dawson Ave Unit 302
- 794 S Chesterfield Rd
- 2425 Bryden Rd
- 1052 S Roosevelt Ave
- 2877 Astor Ave
- 2736 Eastminster Rd
- 2770 Eastminster Rd
- 2350 Bryden Rd
- 633 Eastmoor Blvd
- 2856 Eastminster Rd
- 866-868 Sheridan Ave
- 618 Eastmoor Blvd
- 655 Brookside Dr
- 1205 Kenwick Rd
- 2963 Brownlee Ave
- 755 Vernon Rd
- 765 Vernon Rd
- 747 Vernon Rd
- 771 Vernon Rd
- 777 Vernon Rd
- 754 S Remington Rd
- 739 Vernon Rd
- 748 S Remington Rd
- 760 S Remington Rd
- 744 S Remington Rd
- 783 Vernon Rd
- 766 S Remington Rd
- 762 Vernon Rd
- 766 Vernon Rd
- 738 S Remington Rd
- 756 Vernon Rd
- 774 Vernon Rd
- 752 Vernon Rd
- 772 S Remington Rd
- 733 Vernon Rd