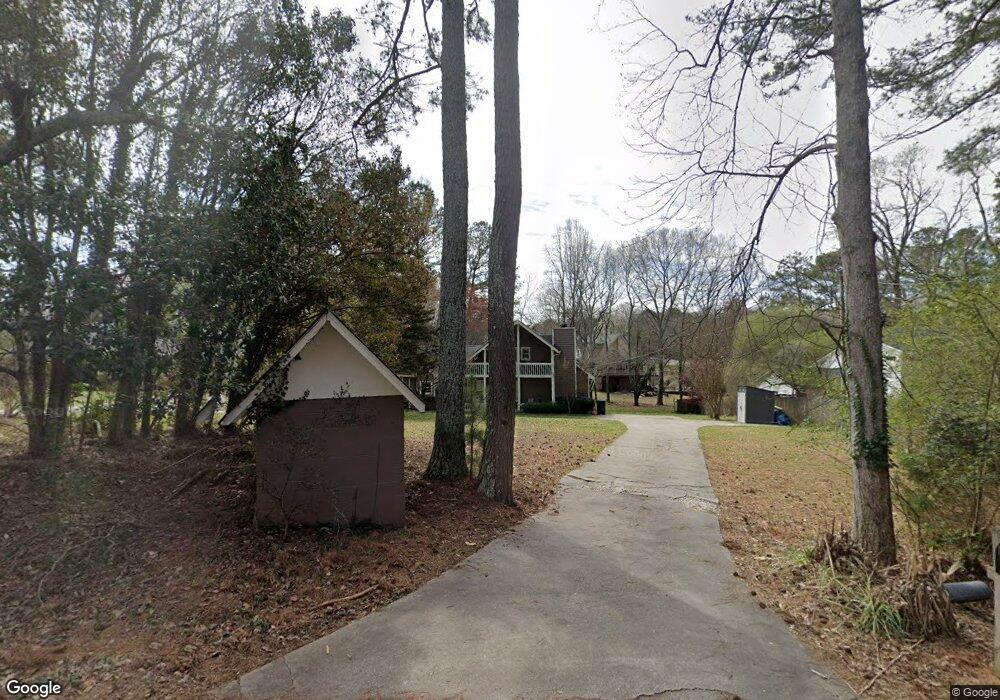
7610 Fields Dr Cumming, GA 30041
Estimated Value: $313,000 - $490,000
3
Beds
3
Baths
1,944
Sq Ft
$211/Sq Ft
Est. Value
About This Home
This home is located at 7610 Fields Dr, Cumming, GA 30041 and is currently estimated at $410,056, approximately $210 per square foot. 7610 Fields Dr is a home located in Forsyth County with nearby schools including Chattahoochee Elementary School, Little Mill Middle School, and Cornerstone Schools.
Ownership History
Date
Name
Owned For
Owner Type
Purchase Details
Closed on
Sep 15, 2020
Sold by
Marquardt Brenda J
Bought by
Trammell Jill D
Current Estimated Value
Purchase Details
Closed on
Dec 31, 2007
Sold by
Cwabs Inc Series 2006 & 18
Bought by
Marquardt Brenda J
Home Financials for this Owner
Home Financials are based on the most recent Mortgage that was taken out on this home.
Original Mortgage
$99,000
Interest Rate
6.05%
Mortgage Type
New Conventional
Purchase Details
Closed on
Sep 4, 2007
Sold by
Parker Donald G and Parker Jackie L
Bought by
Cwabs Inc Series 2006 & 18
Purchase Details
Closed on
Nov 12, 1993
Sold by
Preston Mccluer
Bought by
Parker Donald G Jackie L
Home Financials for this Owner
Home Financials are based on the most recent Mortgage that was taken out on this home.
Original Mortgage
$80,750
Interest Rate
6.95%
Create a Home Valuation Report for This Property
The Home Valuation Report is an in-depth analysis detailing your home's value as well as a comparison with similar homes in the area
Home Values in the Area
Average Home Value in this Area
Purchase History
| Date | Buyer | Sale Price | Title Company |
|---|---|---|---|
| Trammell Jill D | -- | -- | |
| Marquardt Brenda J | $110,000 | -- | |
| Cwabs Inc Series 2006 & 18 | $142,360 | -- | |
| Parker Donald G Jackie L | $85,000 | -- |
Source: Public Records
Mortgage History
| Date | Status | Borrower | Loan Amount |
|---|---|---|---|
| Previous Owner | Marquardt Brenda J | $99,000 | |
| Previous Owner | Parker Donald G Jackie L | $80,750 |
Source: Public Records
Tax History
| Year | Tax Paid | Tax Assessment Tax Assessment Total Assessment is a certain percentage of the fair market value that is determined by local assessors to be the total taxable value of land and additions on the property. | Land | Improvement |
|---|---|---|---|---|
| 2025 | $3,198 | $132,240 | $50,000 | $82,240 |
| 2024 | $3,198 | $130,400 | $46,000 | $84,400 |
| 2023 | $3,290 | $133,680 | $36,000 | $97,680 |
Source: Public Records
Map
Nearby Homes
- 7370 Fields Dr
- 6930 Heard Rd
- 6960 Heard Rd
- 6940 Heard Rd
- 6950 Heard Rd
- 7125 Heard Rd
- 7530 Heard Rd
- 0 Indian Knoll Rd Unit 7638013
- 6860 Heard Ln
- 6830 Heard Ln
- 7160 Shady Grove Rd
- 6700 Shady Grove Rd
- 7590 Golden Sands Dr
- 6710 Timber Trail
- LOT 38 Hamilton
- 6705 Shady Grove Rd
- 6685 Driskell Rd
- 7635 Chestnut Hill Rd
- 6965 Flowery Branch Rd
- 7725 Mill Cove Rd
Your Personal Tour Guide
Ask me questions while you tour the home.