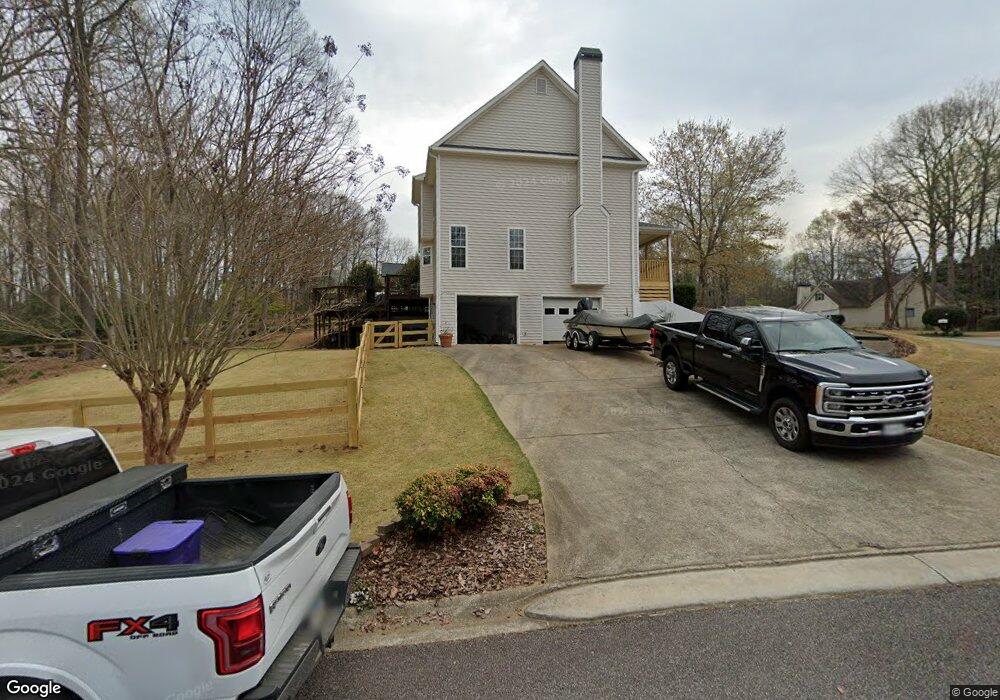
7610 Ivy Grove St Cumming, GA 30040
Estimated Value: $436,647 - $469,000
3
Beds
4
Baths
2,060
Sq Ft
$220/Sq Ft
Est. Value
About This Home
This home is located at 7610 Ivy Grove St, Cumming, GA 30040 and is currently estimated at $453,662, approximately $220 per square foot. 7610 Ivy Grove St is a home located in Forsyth County with nearby schools including Coal Mountain Elementary School, North Forsyth Middle School, and North Forsyth High School.
Ownership History
Date
Name
Owned For
Owner Type
Purchase Details
Closed on
Jun 14, 2004
Sold by
Scanlon Jason A and Scanlon Joy
Bought by
Weaver John
Current Estimated Value
Home Financials for this Owner
Home Financials are based on the most recent Mortgage that was taken out on this home.
Original Mortgage
$191,987
Outstanding Balance
$95,733
Interest Rate
6.3%
Mortgage Type
VA
Estimated Equity
$357,929
Purchase Details
Closed on
Jul 23, 1999
Sold by
Nation Built Homes Inc
Bought by
Scanlon Jason A and Scanlon Joy M
Home Financials for this Owner
Home Financials are based on the most recent Mortgage that was taken out on this home.
Original Mortgage
$149,900
Interest Rate
7.5%
Mortgage Type
New Conventional
Purchase Details
Closed on
Feb 17, 1998
Sold by
Eagle Devel Corp
Bought by
Nation Built Homes
Home Financials for this Owner
Home Financials are based on the most recent Mortgage that was taken out on this home.
Original Mortgage
$106,500
Interest Rate
6.86%
Mortgage Type
New Conventional
Create a Home Valuation Report for This Property
The Home Valuation Report is an in-depth analysis detailing your home's value as well as a comparison with similar homes in the area
Home Values in the Area
Average Home Value in this Area
Purchase History
| Date | Buyer | Sale Price | Title Company |
|---|---|---|---|
| Weaver John | $195,000 | -- | |
| Scanlon Jason A | $157,800 | -- | |
| Nation Built Homes | $27,000 | -- |
Source: Public Records
Mortgage History
| Date | Status | Borrower | Loan Amount |
|---|---|---|---|
| Open | Weaver John | $191,987 | |
| Previous Owner | Scanlon Jason A | $149,900 | |
| Previous Owner | Nation Built Homes | $106,500 |
Source: Public Records
Tax History Compared to Growth
Tax History
| Year | Tax Paid | Tax Assessment Tax Assessment Total Assessment is a certain percentage of the fair market value that is determined by local assessors to be the total taxable value of land and additions on the property. | Land | Improvement |
|---|---|---|---|---|
| 2025 | $3,578 | $174,400 | $52,000 | $122,400 |
| 2024 | $3,578 | $180,784 | $48,000 | $132,784 |
| 2023 | $3,052 | $170,644 | $36,000 | $134,644 |
| 2022 | $3,157 | $112,824 | $24,000 | $88,824 |
| 2021 | $2,766 | $112,824 | $24,000 | $88,824 |
| 2020 | $2,689 | $109,052 | $24,000 | $85,052 |
| 2019 | $2,596 | $104,360 | $20,000 | $84,360 |
| 2018 | $2,449 | $96,748 | $18,000 | $78,748 |
| 2017 | $2,167 | $82,976 | $16,000 | $66,976 |
| 2016 | $2,167 | $82,976 | $16,000 | $66,976 |
| 2015 | $2,129 | $80,976 | $14,000 | $66,976 |
| 2014 | $1,854 | $73,328 | $12,000 | $61,328 |
Source: Public Records
Map
Nearby Homes
- 7620 Ivy Grove St
- 7670 Rose Ln
- 4975 Thalley Creek Dr
- 4985 Thalley Creek Dr
- 4995 Thalley Creek Dr
- 4990 Thalley Creek Dr
- 4845 Rosarian Dr
- 4905 Rosarian Dr
- 4710 Rosarian Dr
- 4685 Rosarian Dr
- 4915 Rosarian Dr
- 6445 Crystal Ln
- 4950 Magnolia Creek Dr
- 6000 John Burruss Rd
- 6255 Dana Way
- 6230 Dana Way
- 5010 Heardmont Trace Rd
- 5520 Allegre Place
- 6260 Dexters Dr
- 5395 Coltman Dr
- 7520 Morning Dew Dr Unit 3
- 7605 Ivy Grove St Unit 3
- 7510 Morning Dew Dr Unit 3
- 7525 Morning Dew Dr Unit 3
- 7525 Morning Dew Dr
- 7595 Ivy Grove St
- 7515 Morning Dew Dr
- 7720 Rose Ln
- 7470 Morning Dew Dr Unit 3
- 7580 Ivy Grove St
- 7690 Rose Ln Unit 3
- 7455 Hickory Bluff Dr Unit 3
- 7585 Ivy Grove St
- 7695 Rose Ln
- 7730 Rose Ln
- 7715 Rose Ln
- 7460 Morning Dew Dr
- 7465 Morning Dew Dr
- 7575 Ivy Grove St
- 7570 Ivy Grove St