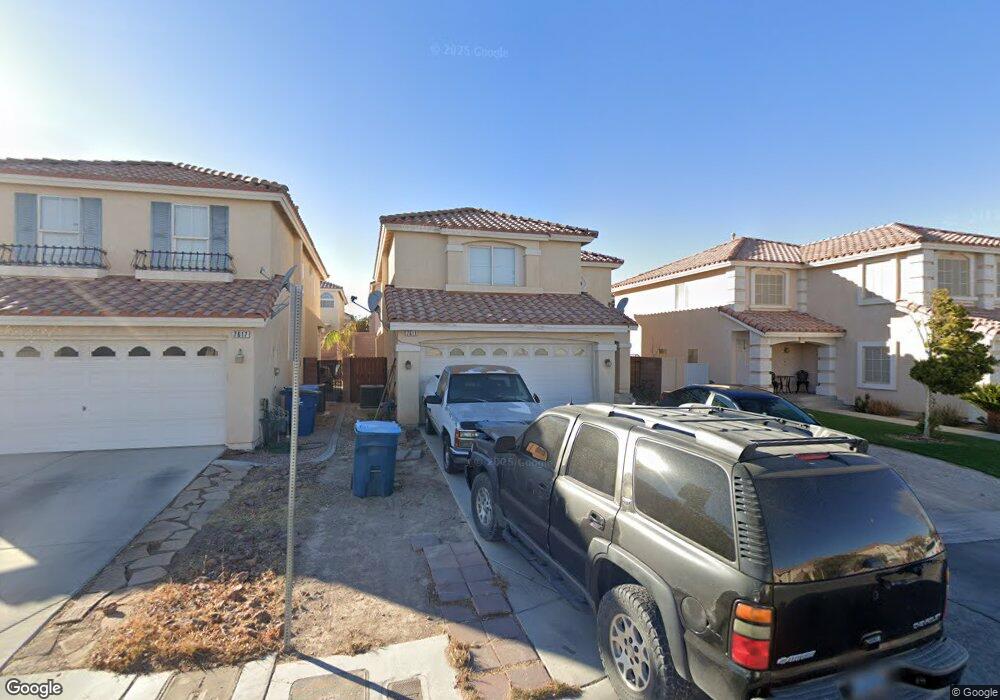
7611 Glorietta Bay Ct Las Vegas, NV 89139
Coronado Ranch NeighborhoodEstimated Value: $409,649 - $435,000
4
Beds
3
Baths
1,668
Sq Ft
$251/Sq Ft
Est. Value
About This Home
This home is located at 7611 Glorietta Bay Ct, Las Vegas, NV 89139 and is currently estimated at $419,412, approximately $251 per square foot. 7611 Glorietta Bay Ct is a home located in Clark County with nearby schools including Dr. Beverly S. Mathis Elementary School, Lawrence & Heidi Canarelli Middle School, and Desert Oasis High School.
Ownership History
Date
Name
Owned For
Owner Type
Purchase Details
Closed on
Jan 20, 2018
Sold by
Wenleder Courtney
Bought by
Peck Ryan and Peck Mccall
Current Estimated Value
Purchase Details
Closed on
Sep 13, 2017
Sold by
Liu Xiao Yan and Zhang Ze Jian
Bought by
Khesbak Sabah and Sheabaan Maysoon
Purchase Details
Closed on
Dec 17, 2012
Sold by
Yabut Ernesto
Bought by
Liu Xiao Yan and Zhang Ze Jian
Purchase Details
Closed on
Jul 27, 2005
Sold by
Yabut Arlene
Bought by
Yabut Ernesto
Home Financials for this Owner
Home Financials are based on the most recent Mortgage that was taken out on this home.
Original Mortgage
$243,750
Interest Rate
1.25%
Mortgage Type
Negative Amortization
Purchase Details
Closed on
Jul 22, 2002
Sold by
American West Homes Inc
Bought by
Yabut Ernesto and Yabut Arlene
Home Financials for this Owner
Home Financials are based on the most recent Mortgage that was taken out on this home.
Original Mortgage
$145,700
Interest Rate
6.52%
Create a Home Valuation Report for This Property
The Home Valuation Report is an in-depth analysis detailing your home's value as well as a comparison with similar homes in the area
Home Values in the Area
Average Home Value in this Area
Purchase History
| Date | Buyer | Sale Price | Title Company |
|---|---|---|---|
| Peck Ryan | $218,500 | Equity Title Of Nevada | |
| Khesbak Sabah | $242,000 | Lawyers Title Las Vegas | |
| Liu Xiao Yan | $139,800 | North American Title Sahara | |
| Yabut Ernesto | -- | Stewart Title Of Nevada | |
| Yabut Ernesto | $153,450 | First American Title Co |
Source: Public Records
Mortgage History
| Date | Status | Borrower | Loan Amount |
|---|---|---|---|
| Previous Owner | Yabut Ernesto | $243,750 | |
| Previous Owner | Yabut Ernesto | $145,700 |
Source: Public Records
Tax History Compared to Growth
Tax History
| Year | Tax Paid | Tax Assessment Tax Assessment Total Assessment is a certain percentage of the fair market value that is determined by local assessors to be the total taxable value of land and additions on the property. | Land | Improvement |
|---|---|---|---|---|
| 2025 | $2,257 | $103,926 | $36,750 | $67,176 |
| 2024 | $2,090 | $103,926 | $36,750 | $67,176 |
| 2023 | $2,090 | $96,704 | $33,250 | $63,454 |
| 2022 | $1,936 | $86,701 | $28,700 | $58,001 |
| 2021 | $1,793 | $81,066 | $25,900 | $55,166 |
| 2020 | $1,662 | $78,067 | $23,450 | $54,617 |
| 2019 | $1,557 | $76,200 | $22,400 | $53,800 |
| 2018 | $1,486 | $68,680 | $17,150 | $51,530 |
| 2017 | $1,392 | $68,619 | $16,450 | $52,169 |
| 2016 | $1,392 | $64,324 | $12,250 | $52,074 |
| 2015 | $1,388 | $57,207 | $10,500 | $46,707 |
| 2014 | $1,345 | $44,494 | $6,300 | $38,194 |
Source: Public Records
Map
Nearby Homes
- 7468 Treasure Chest St
- 7724 Somerhill Point Way
- 7478 Coastal Ledge St
- 7766 Pacific Dunes St
- 5481 Railroad River Ave
- 6111 Walker Valley Ct
- 7819 Harp Tree St
- 7813 Westwind Rd
- 7658 Sandhaven St
- 7569 Garden Galley St
- 7688 Sandhaven St
- 5419 Floating Flower Ave
- 7665 Sandhaven St
- 5986 Ambleshire Ave
- 7463 Grizzly Giant St
- 7451 Grizzly Giant St
- 5431 Hasley Canyon Ave
- 5597 Fewkes Canyon Ct
- 7553 Rustic Galleon St
- 5390 Montauck Ave
- 7617 Glorietta Bay Ct
- 7605 Glorietta Bay Ct Unit 1
- 7623 Glorietta Bay Ct
- 7601 Treasure Chest St Unit 2
- 7610 Ribbon Rock Ct
- 7610 Ribbon Rock Ct
- 7610 Ribbon Rock Ct
- 7610 Ribbon Rock Ct
- 7604 Ribbon Rock Ct
- 7616 Ribbon Rock Ct Unit 1
- 7629 Glorietta Bay Ct
- 7600 Jacaranda Leaf St Unit 2
- 7593 Treasure Chest St Unit 2
- 7622 Ribbon Rock Ct Unit 1
- 7592 Jacaranda Leaf St
- 7618 Glorietta Bay Ct
- 7612 Glorietta Bay Ct
- 7606 Glorietta Bay Ct Unit 1
- 7628 Ribbon Rock Ct Unit n/a
- 7628 Ribbon Rock Ct