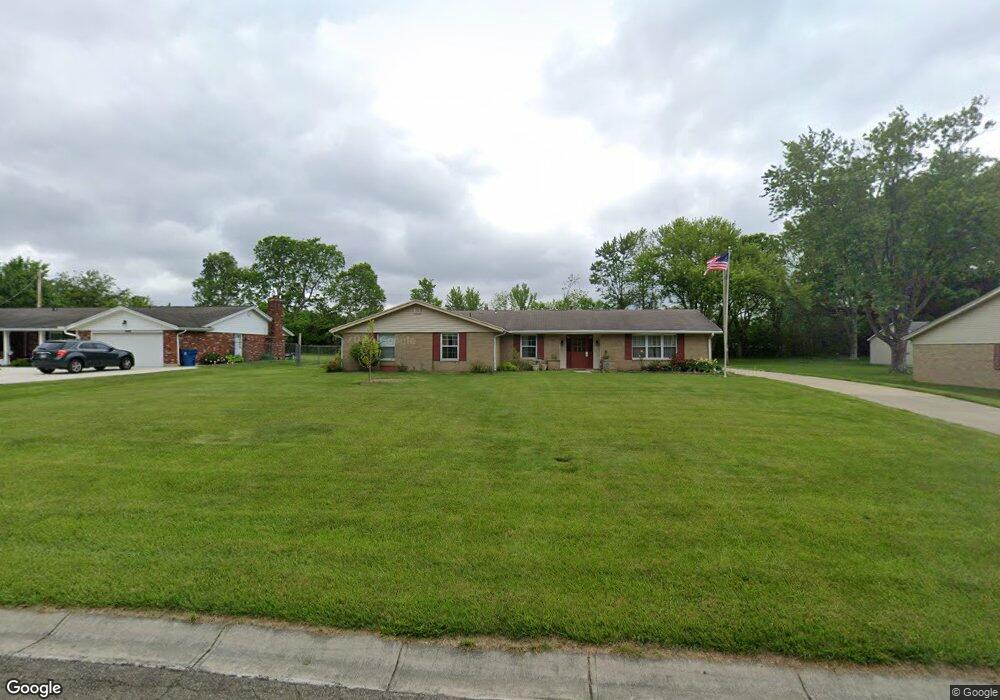
7611 Mark Ave Dayton, OH 45424
Estimated Value: $271,000 - $316,000
4
Beds
3
Baths
2,349
Sq Ft
$129/Sq Ft
Est. Value
About This Home
This home is located at 7611 Mark Ave, Dayton, OH 45424 and is currently estimated at $302,165, approximately $128 per square foot. 7611 Mark Ave is a home located in Montgomery County with nearby schools including Wayne High School and Huber Heights Christian Academy.
Ownership History
Date
Name
Owned For
Owner Type
Purchase Details
Closed on
Jun 28, 2024
Sold by
Haney Raleigh O
Bought by
Hawley Michael Scott and Hawley Cheryl A
Current Estimated Value
Home Financials for this Owner
Home Financials are based on the most recent Mortgage that was taken out on this home.
Original Mortgage
$120,000
Outstanding Balance
$118,135
Interest Rate
6.99%
Mortgage Type
New Conventional
Estimated Equity
$184,030
Purchase Details
Closed on
Dec 22, 2008
Sold by
Collins Donal T and Collins James A
Bought by
Haney Raleigh O and Haney Ceceilia A
Purchase Details
Closed on
Jan 23, 2003
Sold by
Collins James A and Collins Frances G
Bought by
Collins James A and Collins Frances G
Purchase Details
Closed on
Feb 10, 2000
Sold by
Collins James A and Collins Frances G
Bought by
Collins James A and Collins Frances G
Create a Home Valuation Report for This Property
The Home Valuation Report is an in-depth analysis detailing your home's value as well as a comparison with similar homes in the area
Home Values in the Area
Average Home Value in this Area
Purchase History
| Date | Buyer | Sale Price | Title Company |
|---|---|---|---|
| Hawley Michael Scott | $260,000 | None Listed On Document | |
| Haney Raleigh O | $159,900 | Attorney | |
| Collins James A | -- | -- | |
| Collins James A | -- | Midwest Abstract Company |
Source: Public Records
Mortgage History
| Date | Status | Borrower | Loan Amount |
|---|---|---|---|
| Open | Hawley Michael Scott | $120,000 |
Source: Public Records
Tax History
| Year | Tax Paid | Tax Assessment Tax Assessment Total Assessment is a certain percentage of the fair market value that is determined by local assessors to be the total taxable value of land and additions on the property. | Land | Improvement |
|---|---|---|---|---|
| 2025 | $4,490 | $94,790 | $17,440 | $77,350 |
| 2024 | $4,367 | $94,790 | $17,440 | $77,350 |
| 2023 | $4,367 | $94,790 | $17,440 | $77,350 |
| 2022 | $3,522 | $62,640 | $11,550 | $51,090 |
| 2021 | $3,534 | $62,640 | $11,550 | $51,090 |
| 2020 | $3,530 | $62,640 | $11,550 | $51,090 |
| 2019 | $3,369 | $54,250 | $10,500 | $43,750 |
| 2018 | $3,380 | $54,250 | $10,500 | $43,750 |
| 2017 | $3,357 | $54,250 | $10,500 | $43,750 |
| 2016 | $3,475 | $54,670 | $10,500 | $44,170 |
| 2015 | $3,430 | $54,670 | $10,500 | $44,170 |
| 2014 | $3,430 | $54,670 | $10,500 | $44,170 |
| 2012 | -- | $58,150 | $11,900 | $46,250 |
Source: Public Records
Map
Nearby Homes
- 7250 Robindale St
- 7515 Beldale Ave
- 7424 Chatlake Dr
- 7100 Chatlake Dr
- 7302 Belle Plain Dr
- 7237 Carmelita Dr
- 7317 Cosner Dr
- 7201 Belle Plain Dr
- 7368 San Fernando Rd
- 6822 Wintergreen Place
- 6809 Wintergreen Place
- 7000 Taylorsville Rd
- 7507 Chambersburg Rd
- 7821 Wedgemere Cir
- 7178 Ballauer Place
- 7401 Ballauer Place
- 7621 Shalamar Dr
- 6508 Hemingway Rd
- 2020 Cedar Lake Dr
- 6105 Leyden Ln Unit 136105
Your Personal Tour Guide
Ask me questions while you tour the home.