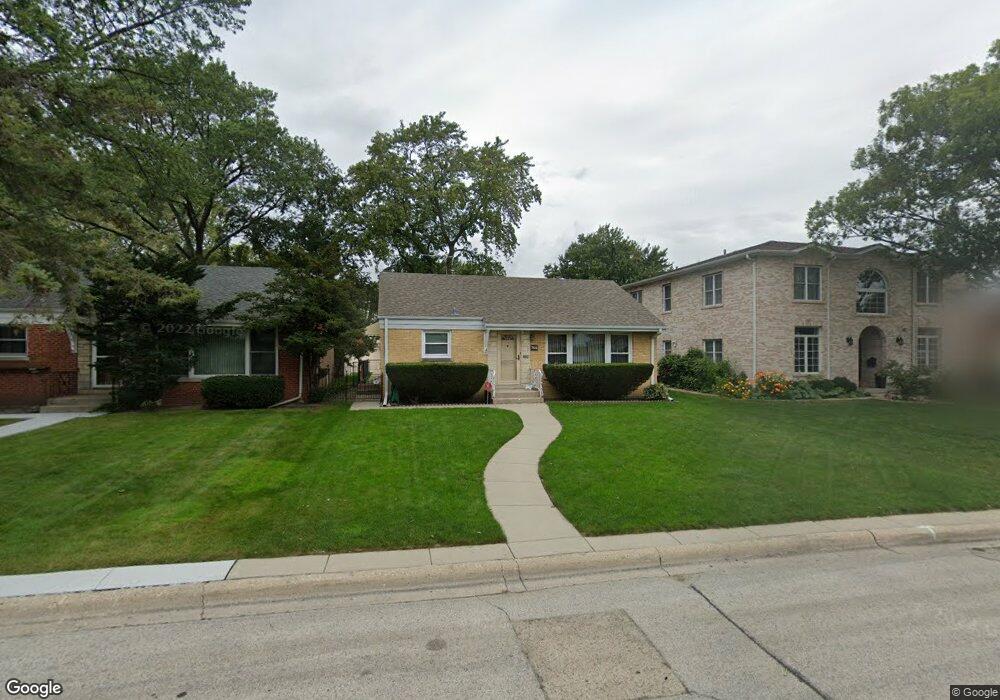
7614 Park Ave Skokie, IL 60077
Southwest Skokie NeighborhoodEstimated Value: $372,000 - $399,420
2
Beds
1
Bath
1,008
Sq Ft
$377/Sq Ft
Est. Value
About This Home
This home is located at 7614 Park Ave, Skokie, IL 60077 and is currently estimated at $380,105, approximately $377 per square foot. 7614 Park Ave is a home located in Cook County with nearby schools including Fairview South Elementary School, Niles West High School, and Cheder Lubavitch Hebrew Day School.
Ownership History
Date
Name
Owned For
Owner Type
Purchase Details
Closed on
Aug 22, 2005
Sold by
Hacker Jeffery A
Bought by
Hacker Jeffery A and Hacker Nanci
Current Estimated Value
Purchase Details
Closed on
Oct 31, 2000
Sold by
Cuvalo Susan and Cuvalo Frano
Bought by
Hacker Jeffery A
Purchase Details
Closed on
Jun 28, 1999
Sold by
Gonzalez Luis A and Diaz Gonzalez Maria Delrocio
Bought by
Cuvalo Susan and Cuvalo Frano
Home Financials for this Owner
Home Financials are based on the most recent Mortgage that was taken out on this home.
Original Mortgage
$161,555
Interest Rate
7.29%
Mortgage Type
FHA
Purchase Details
Closed on
May 23, 1994
Sold by
Yuan Yihua
Bought by
Riocio Gonzalez Luis A and Riocio Diaz Gonzalez Maria Del
Home Financials for this Owner
Home Financials are based on the most recent Mortgage that was taken out on this home.
Original Mortgage
$130,000
Interest Rate
8.34%
Create a Home Valuation Report for This Property
The Home Valuation Report is an in-depth analysis detailing your home's value as well as a comparison with similar homes in the area
Home Values in the Area
Average Home Value in this Area
Purchase History
| Date | Buyer | Sale Price | Title Company |
|---|---|---|---|
| Hacker Jeffery A | -- | Chicago Title Insurance Comp | |
| Hacker Jeffery A | $200,000 | -- | |
| Cuvalo Susan | $175,000 | First American Title | |
| Riocio Gonzalez Luis A | $144,500 | -- |
Source: Public Records
Mortgage History
| Date | Status | Borrower | Loan Amount |
|---|---|---|---|
| Previous Owner | Cuvalo Susan | $161,555 | |
| Previous Owner | Riocio Gonzalez Luis A | $130,000 |
Source: Public Records
Tax History Compared to Growth
Tax History
| Year | Tax Paid | Tax Assessment Tax Assessment Total Assessment is a certain percentage of the fair market value that is determined by local assessors to be the total taxable value of land and additions on the property. | Land | Improvement |
|---|---|---|---|---|
| 2024 | $6,310 | $30,000 | $7,093 | $22,907 |
| 2023 | $6,100 | $30,000 | $7,093 | $22,907 |
| 2022 | $6,100 | $30,000 | $7,093 | $22,907 |
| 2021 | $5,234 | $23,508 | $4,364 | $19,144 |
| 2020 | $5,056 | $23,508 | $4,364 | $19,144 |
| 2019 | $5,220 | $26,414 | $4,364 | $22,050 |
| 2018 | $4,342 | $20,617 | $3,955 | $16,662 |
| 2017 | $4,398 | $20,617 | $3,955 | $16,662 |
| 2016 | $4,389 | $20,617 | $3,955 | $16,662 |
| 2015 | $3,869 | $17,441 | $3,410 | $14,031 |
| 2014 | $3,753 | $17,441 | $3,410 | $14,031 |
| 2013 | $3,797 | $17,441 | $3,410 | $14,031 |
Source: Public Records
Map
Nearby Homes
- 5261 Mulford St
- 5153 Dobson St
- 7507 Frontage Rd
- 7500 Laramie Ave
- 5500 Harvard Terrace
- 5501 Mulford St
- 5251 Galitz St Unit 410
- 5251 Galitz St Unit 311
- 5207 Galitz St
- 7848 Lincoln Ave
- 7748 Lincoln Ave
- 5037 Fargo Ave
- 5505 Oakton St
- 4931 Brummel St
- 4944 Jarvis Ave
- 4907 Hull St
- 4953 Oakton St Unit 510
- 4953 Oakton St Unit P11
- 4953 Oakton St Unit 207
- 4838 Howard St Unit 301