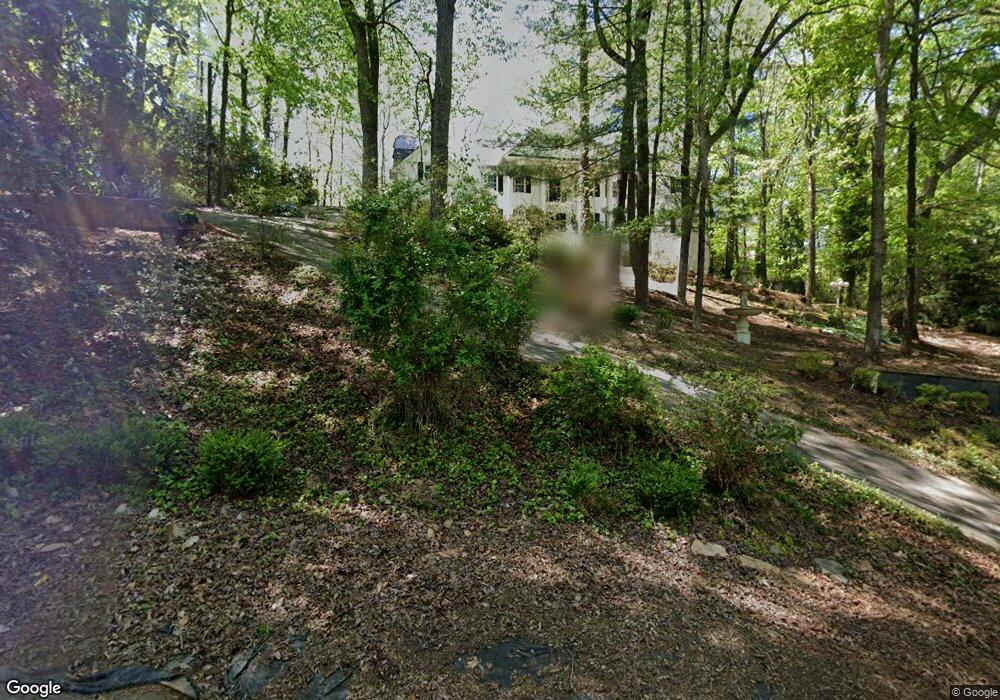
7615 Ball Mill Rd Atlanta, GA 30350
Dunwoody Panhandle NeighborhoodEstimated Value: $762,000 - $1,677,000
5
Beds
5
Baths
2,529
Sq Ft
$426/Sq Ft
Est. Value
About This Home
This home is located at 7615 Ball Mill Rd, Atlanta, GA 30350 and is currently estimated at $1,077,445, approximately $426 per square foot. 7615 Ball Mill Rd is a home located in Fulton County with nearby schools including Dunwoody Springs Elementary School, Sandy Springs Middle School, and North Springs High School.
Ownership History
Date
Name
Owned For
Owner Type
Purchase Details
Closed on
Dec 22, 2010
Sold by
Glusoriani Craig
Bought by
Wamble Rick
Current Estimated Value
Purchase Details
Closed on
Jul 9, 2009
Sold by
Ubs Warburg R/E Secs Inc
Bought by
Womble Rick L
Home Financials for this Owner
Home Financials are based on the most recent Mortgage that was taken out on this home.
Original Mortgage
$220,150
Interest Rate
5.27%
Purchase Details
Closed on
Mar 1, 2005
Sold by
Adams Carl M
Bought by
Bank One Na
Purchase Details
Closed on
Mar 20, 2004
Sold by
Adams Carl
Bought by
Cohen Melvin
Purchase Details
Closed on
Aug 20, 2003
Sold by
Absolute Auction Inc
Bought by
Adams Carl M
Home Financials for this Owner
Home Financials are based on the most recent Mortgage that was taken out on this home.
Original Mortgage
$573,750
Interest Rate
6.13%
Mortgage Type
New Conventional
Create a Home Valuation Report for This Property
The Home Valuation Report is an in-depth analysis detailing your home's value as well as a comparison with similar homes in the area
Home Values in the Area
Average Home Value in this Area
Purchase History
| Date | Buyer | Sale Price | Title Company |
|---|---|---|---|
| Wamble Rick | -- | -- | |
| Womble Rick L | $199,000 | -- | |
| Bank One Na | $442,000 | -- | |
| Cohen Melvin | $450,000 | -- | |
| Adams Carl M | $675,000 | -- |
Source: Public Records
Mortgage History
| Date | Status | Borrower | Loan Amount |
|---|---|---|---|
| Previous Owner | Womble Rick L | $220,150 | |
| Previous Owner | Adams Carl M | $573,750 |
Source: Public Records
Tax History Compared to Growth
Tax History
| Year | Tax Paid | Tax Assessment Tax Assessment Total Assessment is a certain percentage of the fair market value that is determined by local assessors to be the total taxable value of land and additions on the property. | Land | Improvement |
|---|---|---|---|---|
| 2025 | $7,402 | $282,040 | $51,160 | $230,880 |
| 2023 | $7,961 | $282,040 | $51,160 | $230,880 |
| 2022 | $7,093 | $282,040 | $51,160 | $230,880 |
| 2021 | $7,058 | $273,840 | $49,680 | $224,160 |
| 2020 | $6,864 | $244,440 | $55,720 | $188,720 |
| 2019 | $7,012 | $260,280 | $49,600 | $210,680 |
| 2018 | $7,762 | $248,040 | $33,280 | $214,760 |
| 2017 | $6,160 | $194,040 | $29,160 | $164,880 |
| 2016 | $6,159 | $194,040 | $29,160 | $164,880 |
| 2015 | $6,181 | $194,040 | $29,160 | $164,880 |
| 2014 | $6,404 | $194,040 | $29,160 | $164,880 |
Source: Public Records
Map
Nearby Homes
- 7590 Chaparral Dr
- 7565 Ball Mill Rd
- 7570 Chaparral Dr
- 1490 Chevron Dr
- 1620 Saddle Ridge Way
- 1665 Chevron Way
- 1792 Ball Mill Ct
- 2180 Spalding Dr
- 2615 Spalding Dr
- 2660 Spalding Dr
- 535 Old Cobblestone Dr
- 530 Old Cobblestone Dr
- 2413 Spalding Dr
- 8075 Habersham Waters Rd Unit 2
- 4101 Dunwoody Club Dr Unit 49
- 5717 Braddock Ct
- 1605 Saint Tropez Way
- 7680 Jett Ferry Rd
- 1785 Riverside Rd
- 1605 Masters Club Dr
- 1595 Chevron Dr
- 1585 Chevron Dr Unit 1
- 1595 Masters Club Dr
- 0 Ball Mill Rd NE Unit 7245869
- 0 Ball Mill Rd NE Unit 8554798
- 0 Ball Mill Rd NE Unit 8504131
- 0 Ball Mill Rd NE Unit 8467392
- 0 Ball Mill Rd NE Unit 8358500
- 0 Ball Mill Rd NE Unit 8243518
- 0 Ball Mill Rd NE Unit 3258685
- 0 Ball Mill Rd NE Unit 8320728
- 0 Ball Mill Rd NE Unit 8243978
- 0 Ball Mill Rd NE Unit 7637313
- 0 Ball Mill Rd NE Unit 7316913
- 0 Ball Mill Rd NE Unit 8428621
- 0 Ball Mill Rd NE Unit 8369316
- 0 Ball Mill Rd NE Unit 8206070
- 0 Ball Mill Rd NE Unit 8083867
- 0 Ball Mill Rd NE Unit 7357534