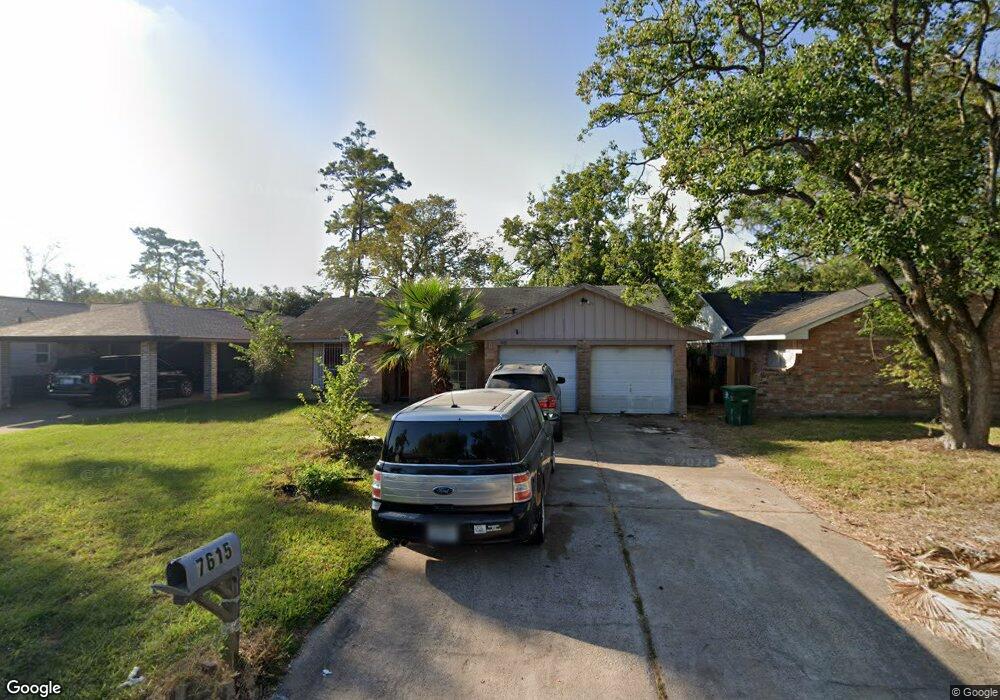
7615 Breezeway St Houston, TX 77040
Greater Inwood NeighborhoodEstimated Value: $177,000 - $210,000
3
Beds
2
Baths
1,005
Sq Ft
$193/Sq Ft
Est. Value
About This Home
This home is located at 7615 Breezeway St, Houston, TX 77040 and is currently estimated at $194,314, approximately $193 per square foot. 7615 Breezeway St is a home located in Harris County with nearby schools including Edward a Vines EC/Pre-K/K School, Ermel Elementary School, and Dr. Viola K. Garcia Middle School.
Ownership History
Date
Name
Owned For
Owner Type
Purchase Details
Closed on
Sep 30, 2013
Sold by
Canady Brett A and Canady Mary Elizabeth
Bought by
Villarruel Jose
Current Estimated Value
Home Financials for this Owner
Home Financials are based on the most recent Mortgage that was taken out on this home.
Original Mortgage
$78,375
Outstanding Balance
$59,166
Interest Rate
4.62%
Mortgage Type
New Conventional
Estimated Equity
$135,148
Purchase Details
Closed on
Jul 11, 2008
Sold by
Tagore Tara Rani
Bought by
Canady Brett A and Canady Mary Elizabeth
Home Financials for this Owner
Home Financials are based on the most recent Mortgage that was taken out on this home.
Original Mortgage
$78,271
Interest Rate
6.11%
Mortgage Type
FHA
Purchase Details
Closed on
Nov 1, 1994
Sold by
Hines Bruce David and Hines Thelma L
Bought by
Tagore Avtar Singh and Tagore Tara Rani
Create a Home Valuation Report for This Property
The Home Valuation Report is an in-depth analysis detailing your home's value as well as a comparison with similar homes in the area
Home Values in the Area
Average Home Value in this Area
Purchase History
| Date | Buyer | Sale Price | Title Company |
|---|---|---|---|
| Villarruel Jose | -- | None Available | |
| Canady Brett A | -- | Startex 05 Title Company | |
| Tagore Avtar Singh | -- | -- |
Source: Public Records
Mortgage History
| Date | Status | Borrower | Loan Amount |
|---|---|---|---|
| Open | Villarruel Jose | $78,375 | |
| Previous Owner | Canady Brett A | $78,271 |
Source: Public Records
Tax History Compared to Growth
Tax History
| Year | Tax Paid | Tax Assessment Tax Assessment Total Assessment is a certain percentage of the fair market value that is determined by local assessors to be the total taxable value of land and additions on the property. | Land | Improvement |
|---|---|---|---|---|
| 2025 | $2,406 | $186,013 | $36,898 | $149,115 |
| 2024 | $2,406 | $178,631 | $35,141 | $143,490 |
| 2023 | $2,406 | $177,086 | $35,141 | $141,945 |
| 2022 | $3,350 | $147,527 | $29,870 | $117,657 |
| 2021 | $3,190 | $126,983 | $29,870 | $97,113 |
| 2020 | $3,050 | $115,558 | $14,642 | $100,916 |
| 2019 | $2,964 | $107,118 | $14,642 | $92,476 |
| 2018 | $1,050 | $98,096 | $14,642 | $83,454 |
| 2017 | $2,498 | $98,096 | $14,642 | $83,454 |
| 2016 | $2,271 | $87,431 | $14,642 | $72,789 |
| 2015 | $973 | $83,855 | $14,642 | $69,213 |
| 2014 | $973 | $70,737 | $14,642 | $56,095 |
Source: Public Records
Map
Nearby Homes
- 7718 Breezeway St
- 9207 Loren Ln
- 9331 Deanwood St
- 9214 Woodland Oaks Dr
- 7318 Shady Grove Ln
- 7731 Deadwood Dr
- 9350 Guywood St
- 7259 Shady Arbor Ln
- 7706 Deadwood Dr
- 9523 Vanwood St
- 8007 E Oakwood Ct
- 7218 Stonegate Dr
- 8020 Oakwood Forest Dr
- 7911 Battleoak Dr
- 7918 Battleoak Dr
- 7051 Majestic Oaks Dr
- 7606 Battlepine Dr
- 7311 Woodoak Dr
- 8615 Black Tern Ln
- 6819 Oakwood Grove
- 7611 Breezeway St
- 7619 Breezeway St
- 7614 Williams St
- 7607 Breezeway St
- 7623 Breezeway St
- 7618 Williams St
- 7610 Williams St
- 7622 Williams St
- 7606 Williams St
- 7614 Breezeway St
- 7618 Breezeway St
- 7603 Breezeway St
- 7610 Breezeway St
- 7703 Breezeway St
- 7622 Breezeway St
- 7702 Williams St
- 7606 Breezeway St
- 7602 Williams St
- 7515 Breezeway St
- 7702 Breezeway St